Healthcare

Why Factory Cost Economics Will Make or Break FMCG Companies in India

The Latent Leak : Why Factory Cost Economics Will Make or Break FMCG Companies in India

The Latent Leak : Why Factory Cost Economics Will Make or Break FMCG Companies in India 1920 1080 qwixpertadmin

When the Numbers Don’t Add Up

Picture this: A mid-sized Pune-based FMCG company manufacturing a popular range of packaged spices and ready-to-cook masalas. Their sales team is hitting targets. Retail shelf presence is growing. The marketing team is buzzing with new campaign ideas. And yet, every quarter review ends with the CFO staring at margins that refuse to budge past 8%, while industry peers are consistently reporting 14-16%.

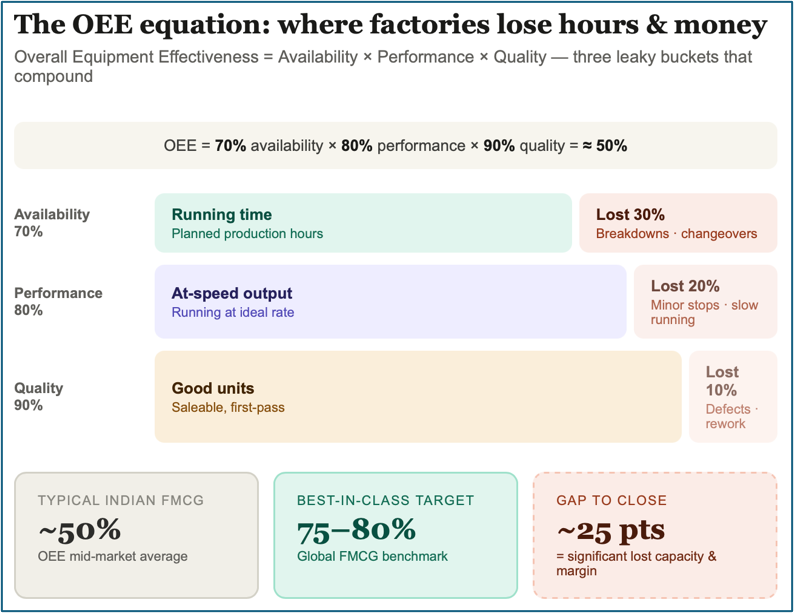
The team blames distributor margins, raw material inflation, GST complexity et al. However, a deeper investigation reveals the uncomfortable truth – ‘the crisis lies inside’.  Conversion cost per kg is 34% higher than the nearest competitor, Overall Equipment Effectiveness (OEE) sits at 51% vis-à-vis leading benchmark of 75-80%, changeover times between SKUs average 4 hrs, yield loss in the blending process has been silently running at 6-7% for years, energy consumption per unit is nearly double to a comparable plant; all absorbed into a catch-all “wastage” line item that no one audits.
It is not a failing company but is one flying blind inside its own factory – and paying dearly for it. This story is not unique. Across India’s FMCG landscape, hundreds of companies, from regional players to large multi-plant enterprises, carry significant hidden cost burdens within their manufacturing operations, simply because factory cost economics has never been treated as a strategic discipline.

How Companies Traditionally Managed Factory Costs

For most of India’s FMCG history – particularly from the liberalisation era through the 2010s – factory cost management, unlike raw material costs, was largely reactive and siloed. The dominant mindset was one of cost containment rather than cost engineering.

Finance teams tracked aggregate budget lines: raw material costs, power and fuel, labour, and overheads. Plant managers focused on throughput – keeping lines running and meeting dispatch targets. The two functions rarely spoke the same language. Finance wanted variance reports; operations wanted production numbers. The cost structure of a factory was treated as essentially fixed, punctuated by annual negotiations with vendors and occasional capital investments in capacity.
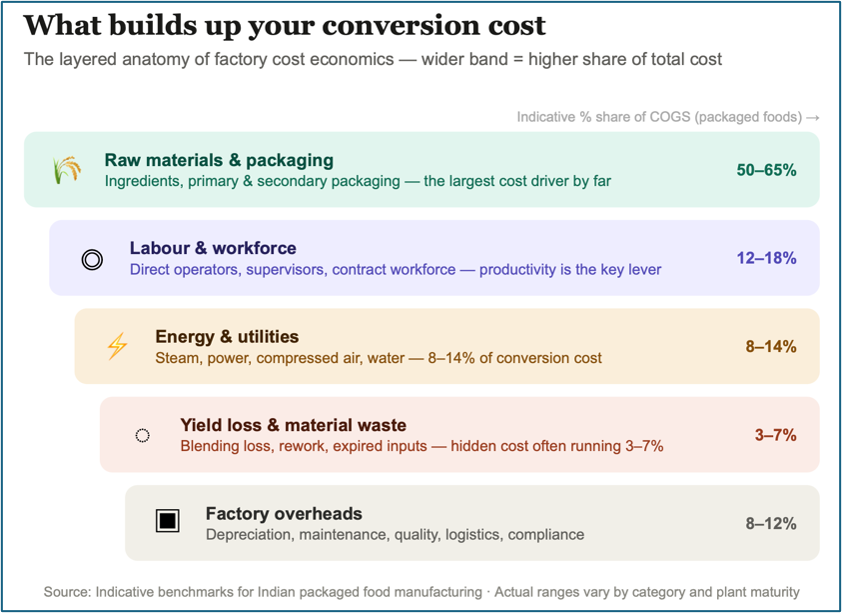
Benchmarking, where it existed, was informal – a plant head comparing notes with a peer at an industry conference, or a consultant’s rule-of-thumb target pulled from a global study with little India-specific context. Standard costing systems were implemented in ERP platforms, but often with assumptions baked in at the time of implementation that were never revisited. A company might technically “know” its standard conversion cost, while being entirely unaware that actual costs had drifted 20-25% above standard over several years.

The tolerance for this ambiguity was enabled by a forgiving macro environment. Rural consumption was growing steadily. Urban premiumisation was expanding category sizes. Input cost cycles, while volatile, were manageable within the pricing power that brand equity afforded. In short, strong top-line growth papered over manufacturing inefficiency. Margins were under pressure, but pressure that could be explained away.

What Has Changed and Why It Can No Longer Be Ignored

The operating environment for FMCG manufacturers in India has shifted structurally, and several forces are converging to make factory cost economics an existential priority rather than a nice-to-have.  Manufacturers within a single FMCG company – both own and contract manufacturers – compete with each other basis the overall cost per unit.
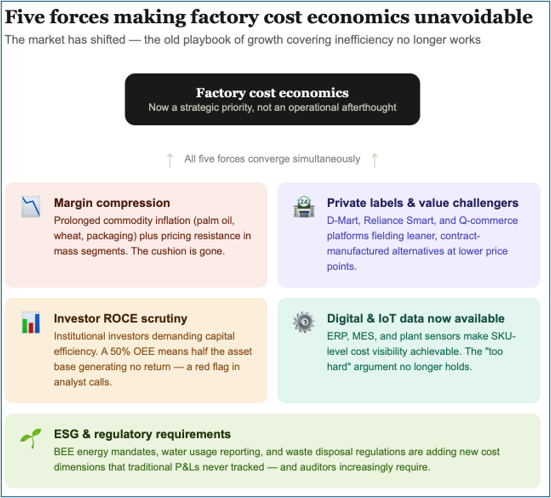
Margin compression is no longer temporary. The post-pandemic years brought a prolonged period of commodity inflation – palm oil, wheat, packaging materials, and fuel all spiked. While commodity prices have partially moderated, input cost volatility has become the new normal. At the same time, competitive intensity has made it increasingly difficult to fully pass on cost increases to consumers through price hikes, particularly in mass and semi-premium segments.

The rise of private labels and value players. Organised retail chains – Reliance Smart, D-Mart, and others – have aggressively expanded private label portfolios. Quick commerce platforms have lowered barriers to entry for challenger brands. These competitors are often leaner by design, built on contract manufacturing arrangements with tightly negotiated conversion costs. Legacy FMCG players cannot compete on price if their cost-to-serve is structurally higher.

Investor scrutiny on capital efficiency. As India’s FMCG sector matures, institutional investors are moving beyond revenue growth metrics to demand ROCE (Return on Capital Employed) improvement. Factories represent the single largest asset on most FMCG balance sheets. An OEE of 50% effectively means half the invested capital is generating no return. This is no longer a footnote – it is a red flag in analyst calls.

Digital and data infrastructure has made granularity possible. The widespread adoption of ERP systems, IoT-enabled plant sensors, and manufacturing execution systems (MES) means that the data required to understand cost at the machine, line, shift, and SKU level now exists – or can be made available at a reasonable investment. There is no longer a credible argument that factory cost visibility is too difficult to achieve.  However, the challenge of getting clean data depends significantly on the maturity of the organization.

Regulatory and sustainability pressures. ESG commitments and Bureau of Energy Efficiency (BEE) mandates are pushing manufacturers to optimise energy consumption. Water usage reporting and waste disposal regulations are adding further cost dimensions that a traditional P&L never tracked rigorously.

The Key Imperatives for Driving Factory Cost Economics

Building genuine capability in factory cost economics requires action across several interconnected dimensions.

Granular cost visibility at the line and SKU level. The first imperative is simply to see clearly. Companies must move beyond plant-level cost aggregates to understand conversion cost per SKU, per line, and per shift. This requires integrating production data with financial systems – a non-trivial exercise, but a foundational one. Without this visibility, every improvement initiative is shooting in the dark.

OEE as a living management metric. Overall Equipment Effectiveness needs to be tracked in near-real-time and cascaded to the shop floor, not compiled monthly for a finance review deck. Availability losses, performance losses, and quality losses must each be addressed with distinct intervention strategies.

Zero-loss thinking in yield and waste. Every gram of raw material that does not become a saleable unit is a cost. Leading FMCG manufacturers globally deploy zero-loss frameworks to systematically identify, quantify, and eliminate yield leakage across the value chain – from intake to filling to packaging.
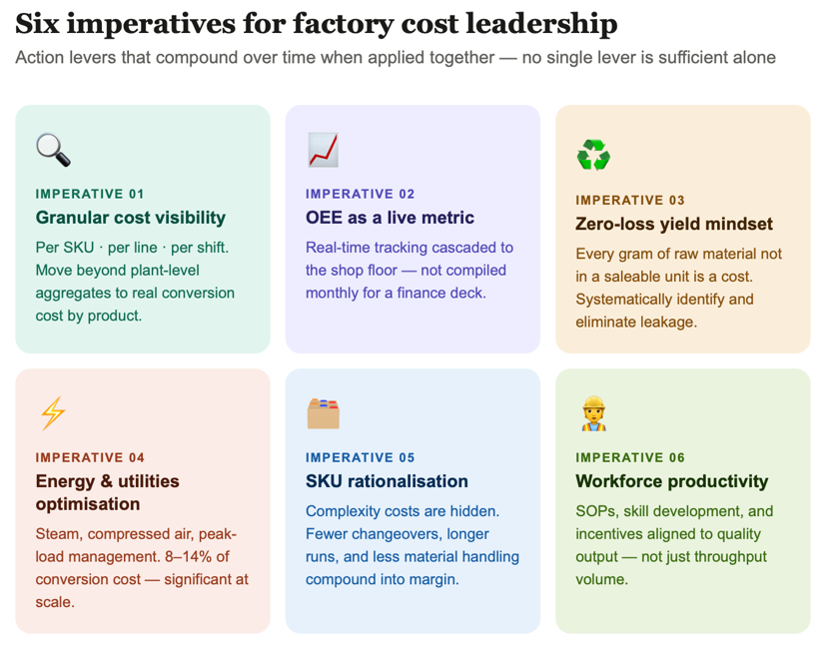
Energy and utilities management. In most food and personal care manufacturing, energy accounts for 8-14% of conversion cost. Steam optimisation, compressed air audits, lighting upgrades, and peak-load management are not glamorous, but they compound significantly at scale.

SKU rationalisation linked to manufacturing complexity. Proliferating SKU portfolios impose hidden complexity costs – more changeovers, shorter runs, higher material handling, greater scheduling friction. Factory cost economics must feed directly into portfolio strategy decisions.

Workforce productivity and capability building. Labour productivity in Indian FMCG manufacturing is highly variable. Structured skill development, standard operating procedures, and incentive alignment between output quality and operator compensation are critical levers.

The Challenges

The path is not without obstacles. The most persistent challenge is cultural – a factory culture where the cost-per-unit is “finance’s problem” and the plant team’s job is simply to produce. Breaking this silo requires sustained leadership commitment and the right incentive structures.

Data quality is a recurring issue. Even companies with ERP systems often find that production reporting is inconsistent, manual entries are error-prone, and the data required to calculate true conversion costs per SKU simply does not exist in a clean form. Building the data foundation is time-consuming and unglamorous work.
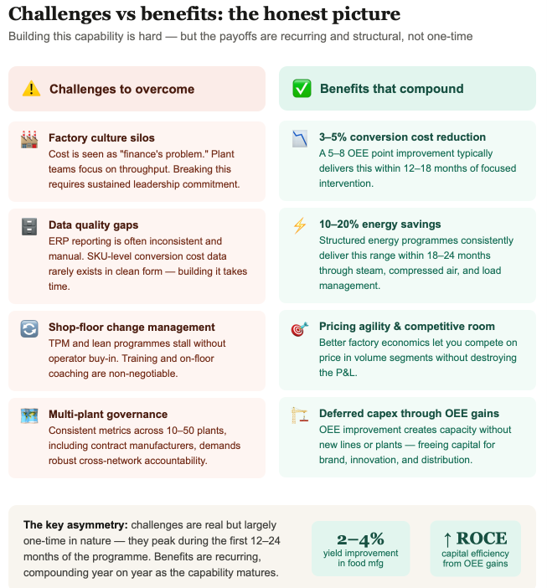
Change management at the plant level is significant. Initiatives like total productive maintenance (TPM) or lean manufacturing require genuine behavioural change from operators and supervisors, not just top-down mandates. Without adequate training and on-the-floor coaching, programmes stall after initial enthusiasm.

Multi-plant coordination is another complexity. Large FMCG companies operate networks of 10, 20, or even 50 plants, often including contract manufacturing partners. Establishing consistent metrics, standards, and accountability across this network requires robust governance.  In addition, an integrated planning to establish which-SKU-to-manufacture-where-and-in-what-quantity is critical, and is nowadays driven through the best commercials offering by the manufacturing setup. Change management at the plant level is significant. Initiatives like total productive maintenance (TPM) or lean manufacturing require genuine behavioural change from operators and supervisors, not just top-down mandates. Without adequate training and on-the-floor coaching, programmes stall after initial enthusiasm.

Multi-plant coordination is another complexity. Large FMCG companies operate networks of 10, 20, or even 50 plants, often including contract manufacturing partners. Establishing consistent metrics, standards, and accountability across this network requires robust governance.  In addition, an integrated planning to establish which-SKU-to-manufacture-where-and-in-what-quantity is critical, and is nowadays driven through the best commercials offering by the manufacturing setup.

The Benefits

The companies that have embedded factory cost economics as a core discipline consistently report compelling outcomes. A 5-8 percentage point improvement in OEE typically translates to a 3-5% reduction in conversion cost – material numbers at FMCG scale. Systematic yield improvement programmes have delivered 2-4% cost reductions in material-intensive categories. Energy optimisation initiatives typically yield 10-20% reduction in energy spend within 18-24 months.

Beyond the direct P&L impact, there are strategic benefits. Better factory economics enable more aggressive pricing in competitive segments without sacrificing margin. They free up capital that would otherwise be spent on premature capacity expansion. They improve agility – a plant with high OEE and short changeover times can respond faster to demand signals.

Most importantly, factory cost visibility creates the foundation for better strategic decisions – about which products to make in-house versus outsource, which plants to invest in, and how to configure a manufacturing network for the next decade of growth.

Conclusion

India’s FMCG sector stands at an inflection point. The era of growth covering up manufacturing inefficiency is ending. As competition intensifies (external and internal), margins tighten, and investors demand capital efficiency, the factory floor is no longer a back-office concern – it is a strategic battleground. Companies that develop genuine capability in factory cost economics will earn structural cost advantages that compound over time, enabling them to invest in brand, innovation, and distribution from a position of strength. Those that continue to fly blind, risk finding themselves permanently disadvantaged – not because of strategy, not because of brands, but because of costs they never thought to measure. The good news is that the tools, data, and methodologies to build this capability are available today. The question is simply whether the organisation has the will to look.

Medical Devices and Consumable: A Sunrise Sector with Lucrative Opportunities and Unique Challenges

Medical Devices and Consumable: A Sunrise Sector with Lucrative Opportunities and Unique Challenges 601 459 qwixpertadmin

Executive Summary

The pandemic hit India in February-March 2020 setting the healthcare industry in overdrive. Patients needed treatment for a hitherto unknown and highly contagious disease, for which the healthcare sector was not prepared. Hospitals and clinics faced a shortage of beds, medicines, consumables, doctors, and lifesaving medical equipment due to both supply disruptions and spikes in demand. Being a truly globalized sector, supply chain disruptions were acutely felt due to import restrictions, logistic hurdles, shutdown of manufacturing operations and labour migration.

At a broad level, the healthcare sector can be divided into 3 sub-sectors – (a) infrastructure (hospitals, diagnostics, clinics, dispensaries), (b) pharmaceuticals (medicines and APIs), and (c) devices and consumables. Devices and consumables, made from various sources – fabric, plastic, rubber, metal – is a ~Rs. 81,700 Cr. market and is growing at 15% YoY. During the pandemic, this demand accelerated in both the local and global markets and the sector witnessed some very innovative and quick shifts.

The industry offers opportunities in the domestic and export market. Three elements are critical to ensure successful market entry & sustained business performance. We elaborate on these in this paper.

  1. Manufacturing processes, standards and the regulations governing them
  2. Customer and distribution channel behaviour
  3. Potential in Indian and Overseas markets (Regulated and Less Regulated markets)

Introduction

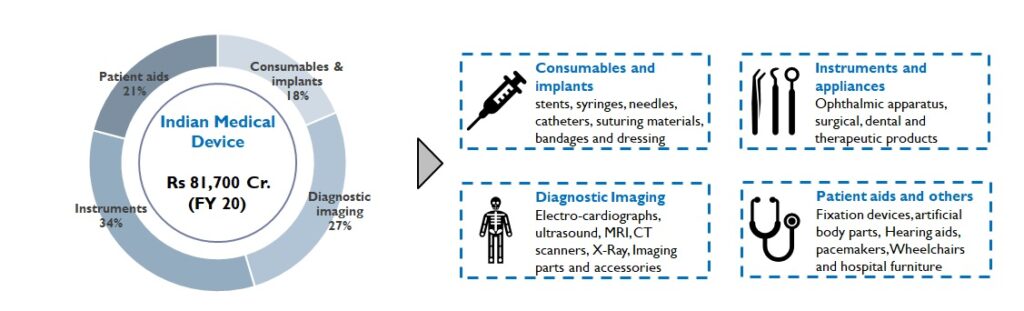
The Indian healthcare industry is valued at Rs. 20 Lac Cr. (FY 20) and is expected to grow 15% YoY. Medical devices and consumables, a part of this industry, is made up of 4 subsegments (Figure 1):

Figure1: Medical Device Segment of India

Several estimates present an extremely favourable picture in the future for the medical devices and consumables segment. Steps taken by the Government – Sunrise sector under Make in India plans, production linked incentives to manufacturers, updated medical devices rules and policies, funds for infrastructure development (medical device parks) – are expected to bear fruit.

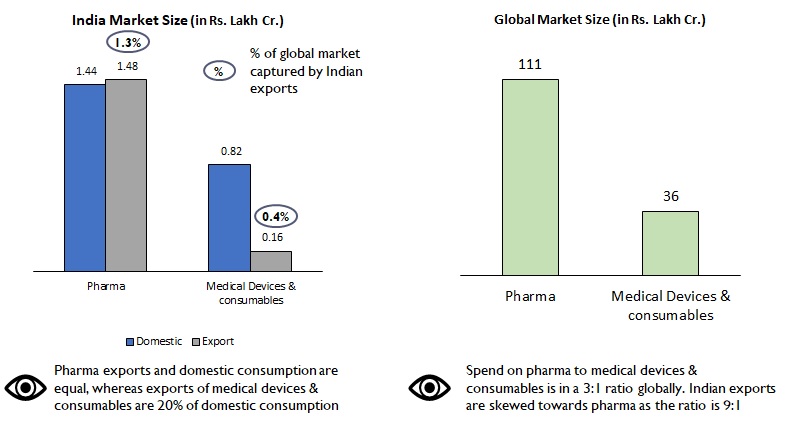
India’s exports contribute to 1.3% of global demand in pharma as against 0.4% in devices and consumables (Figure 2). Also, 50% of our exports of pharmaceuticals (Rs. 75 lac Cr.) are primarily to the more regulated markets of USA, Western Europe, therefore commanding a premium in both product range and price. However, in the medical devices and consumables space, our exports are skewed towards African and Middle Eastern nations with Indian brands targeting the economy product range.

Figure 2: Comparison of market size – Pharma vs Medical devices & consumables

India’s penetration in pharma and medical devices and consumables industries are very different. Domestic pharma manufacturers have advanced facilities that can manufacture drugs of high complexity, whereas in the devices and consumables segment, manufacturing capacity & capability are still at a nascent stage. The segment is characterized also by lack of superior technical expertise, high degree of fragmentation and focus on mass vs premium and niche products/ markets.

We believe that India can extend its superior standing in formulations to become a global leader in devices & consumables as well. With our knowledge and experience of pharma regulation across markets, India has a clear advantage and possibly a head start (as regulation on devices and consumables are generally not as complex for majority of the products) in this sector. Proactive Government policies and funds, growing interest among Indian manufacturers to tap into the vast global market (~Rs. 36 Lac Cr.), pandemic led demand growth and global interest in developing a 2nd manufacturing source beyond China should work in India’s favour. By 2025, experts believe India’s market may grow from Rs. 81,700 Cr. to Rs. 3.7 lac Cr. at a staggering 42% CAGR. Even conservative estimates peg the CAGR at 21% taking the market to Rs. 2.1 lac Cr.

The coronavirus caused an unprecedented surge in demand drawing considerable interest to this segment. For instance, Skanray Technologies formed a consortium with Mahindra & Mahindra and BHEL to manufacture up to 5,000 ventilators a month. Our PPE production capacity exploded from 62 lacs/ yr. to 26 crores/ yr. within a 3-month period thanks to 100+ manufacturers filling the void. Likewise, FMCG and Alcobev manufacturers produced and sold (also donated) alcohol-based hand-sanitizers. Large and small entrepreneurs in textile and apparel started supplying masks, gloves, and coveralls to institutional and individual buyers. While these examples are laudable, it is not enough to distinguish India in the medical consumables space and a more thought through, structured approach is needed to establish global leadership. This is however easier said than done. The segment has its own nuances and complexities. In this document, we examine the most critical of these to succeed.

  1. Manufacturing processes, standards and the regulations governing them

Manufacturing regulations are more stringent vis-à-vis other industries but create robust entry barriers

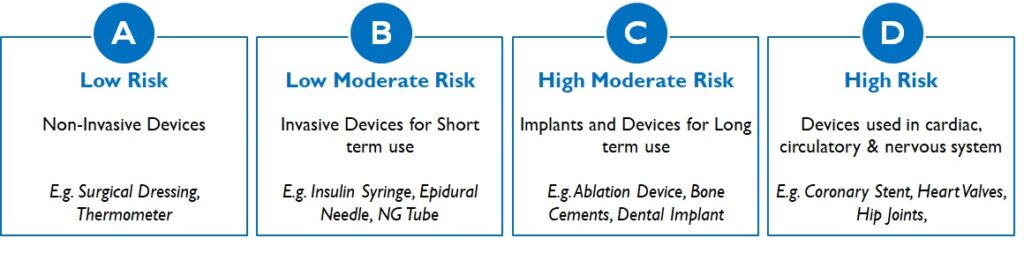
Medical devices are regulated by the Central Drugs Standard Control Organisation and fall under the purview of Indian Medical Device Rules, 2017. It categorises medical devices into 4 risk classes based on the invasiveness, duration of use and criticality of organ / organ function (Figure 3):

Figure 3: Medical Device Classes in India

According to the class of the device and the inspection process, approval authority and timeline to receive a manufacturing licence vary. A Class A/ B device maybe granted a licence in 45 days; whereas for a Class C/D device, licences can take up to 6 months (Figure 4).

Figure 4: Regulatory requirement for Class B and Class D Device

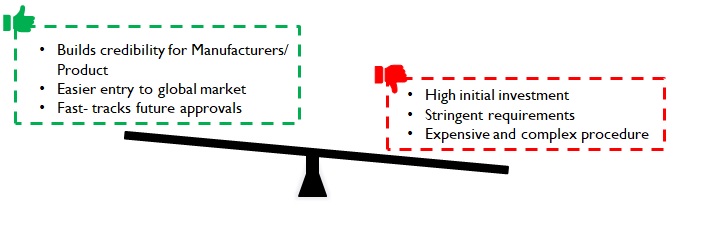
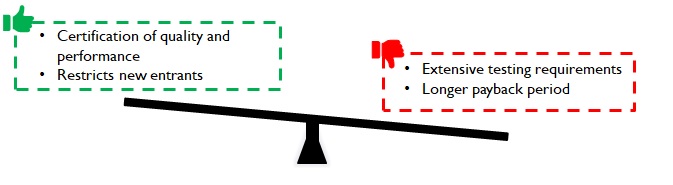
Compliance with extremely strict FDA/ EU regulations is required for export to regulated markets. Customers may expect USA, EU or WHO GMP certification for the manufacturing plants. Further, as medical devices are made in clean rooms, manufacturers have to upgrade their facilities to ISO Class 7 and below (varies basis product) to get the necessary clearance. To meet these standards, initial investment will be high, but the approvals bring credibility to the product and manufacturer. These ease entry into domestic as well as global markets and fast-track future approvals.

Figure 5: Implications of stringent regulations 

Long lead times to regulatory approval impact time to market

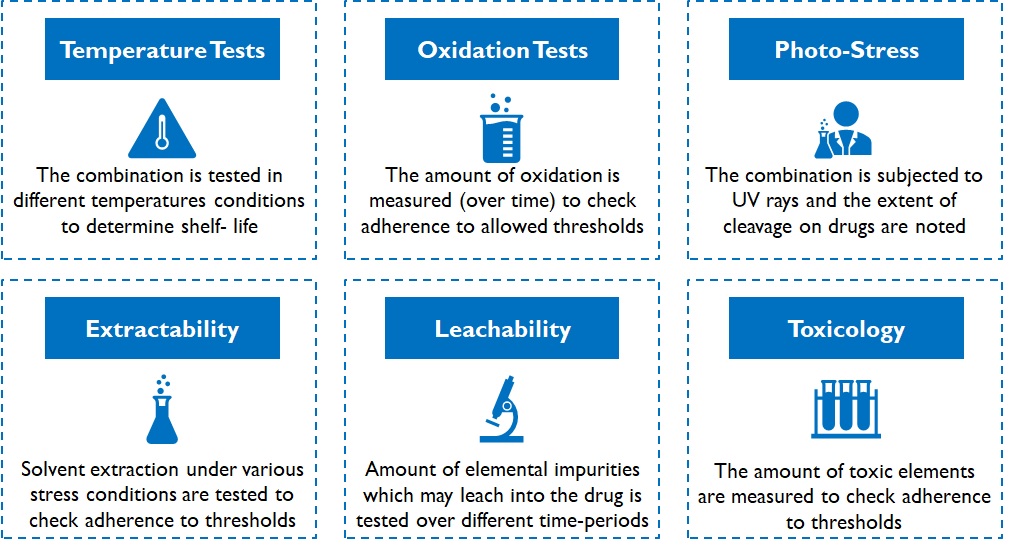
Devices can be classified as: devices with predicate or innovative devices. A device with predicate has the similar intended use, material of construction, and design characteristics as one that already has a licence and hence are eligible for manufacturing and import licences without clinical trials. Clinical trials are mandatory for innovative devices, and only after acceptable results are generated, a manufacturing/ import licence is granted. These mandatory tests determine the device’s performance and safety over several environmental conditions and may even require animal/ human trials. For instance, various kinds of stability and integrity tests are conducted on packaging material of drug products (Figure 6).

Figure 6: Types of tests conducted on packaging material of drugs

Testing duration depends on the shelf-life of the product in case of packaging consumables for drugs. For instance, oxidation tests on cotton for tablet bottles is conducted over a sufficiently large duration (3 – 6 months or more) and results are extrapolated (simulated) further for longer shelf life declarations. Despite simulations, fast-tracking is not very easy. Customers (pharma companies) and regulatory authorities do not dilute / deviate from conservative practices. While the time to develop a viable product may range between 1 – 3 years, depending on product complexity, it acts as a robust barrier for new entrants.

Figure 7: Implications of long lead time

Manufacturers can command premiums with solutions that lead to faster time to market for customers in select product-market combinations

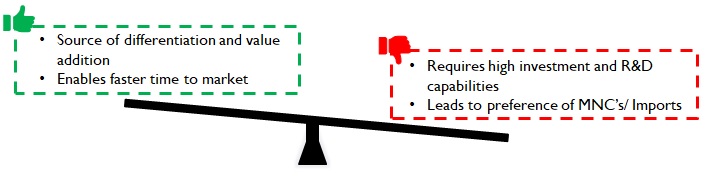
Testing is often conducted and funded by pharma companies. Devices and consumables manufacturers have started to realize this as a source of value addition that commands a premium. For example, Daywyler – a manufacturer of vial stoppers has vast quantities of data on drug reactions for various stopper material compositions. Predictive analytical models generated using this data help Datwyler not just suggest appropriate material compositions for new products, but also help fast track regulatory approvals with years of actual test / use data. This allows pharma companies to be faster with the drug in the market, thereby adding considerably to their revenues and profits.

Datwyler also boasts of an excellent R&D and Regulatory advisory, capable of identifying the minutest of defects and conducting detailed root-cause analysis (in case of product recalls post go-to-market). Pharma companies value this support during contingencies and the subsequent speedy resolution of issues. Most domestic manufacturers in India do not possess high levels of such competencies and hence are substituted by imports despite higher cost and longer lead times.

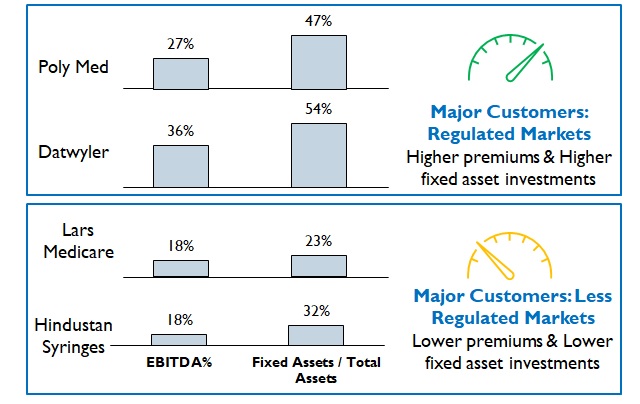
Figure 8: Comparison of Profitability and Investment for different markets

However, premiums commanded depend upon the Product / Market combinations (Figure 8). For example, fluid / wound / fracture management products for Africa or South Asia will require a much lower investment in R&D capabilities and hence command lower premiums.

Figure 9: Implications of product premiumness

  1. Customer and distribution channel behaviour

Conservative customers with inertia impact pace of change but once entrenched yield long-term returns

Customers in the healthcare segment insist on high regulatory compliance from their devices and consumables suppliers. For instance, to partake in RFQ process in top hospital chains in India (especially for Class C or D devices), manufacturers often mandate FDA Approval/ CE Mark for the products and WHO GMP certification for the facility. This is driven by concerns over product quality and costly damage claims associated with defects.

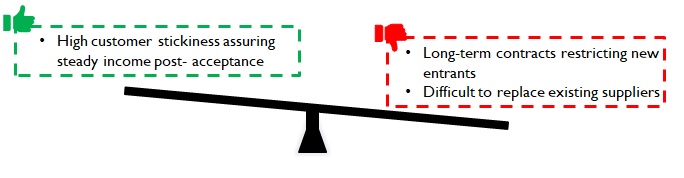
Sales of consumables to pharma companies (Eg: cotton for tablet bottles), or component parts to device manufacturers suffer a high level of customer inertia to any change. For instance, a new supplier may necessitate re-doing the approval process from the start – including manufacturing audit of Tier 2 suppliers (if req.). Hence pharma companies tend to remain associated with suppliers over long contractual periods i.e. during the entire lifecycle of a drug.

Despite the challenges, customers onboard new manufacturers if they can reduce supply lead times leading to incremental revenues; or offer the required quality at lower costs thus adding to their bottom line. While the customer stickiness may prove to be a barrier to entry; once customers are onboarded, a steady source of revenue is assured for a considerable period.

Figure 10: Implications of customer inertia

Distinct distribution network (with distinct regulations) is critical for reach and growth

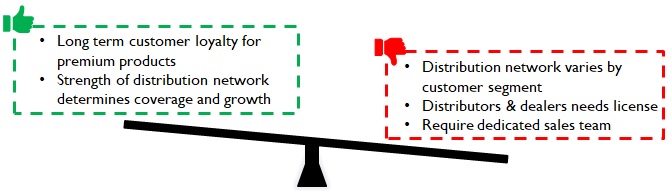
The distribution network for medical devices to hospitals, clinics and dispensaries include multiple intermediaries: distributors, dealers, and sub-dealers (also called surgical dealers), who require a CDSCO licence. The multi-level network ensures last-mile delivery and can cater to emergency demands. Central procurement of large hospitals roll-out annually/ bi-annually tenders (Figure 12):

Figure 11: Supplier selection process

For premium products, doctors play a significant role in brand selection (specifically for more critical products); they stick to familiar brands and tend to be very loyal. In the case of mass market products (Eg: disposable syringes) the L1 bidder tends to get the contract. Medical device representatives engage doctors through seminars, conferences, product demonstration and samplings to convince them about new brands/products.

For clinics, dispensaries and small hospitals in tier 2/3 cities, surgical dealers play a pivotal role in promoting brands to doctors, consolidating orders, and negotiating with hospital team (Figure 12). Dispensaries are important as availability translates into sales highlighting the strength of the distribution network. Manufacturers invest in BTL marketing on dealers (schemes, incentives) to be successful in this segment. (Figure 12)

Figure 12: Distribution process in Small hospitals, clinics, and dispensaries

Manufacturers must be ready to build a sales organization and invest in BTL for market coverage. Distribution is unique; it is a combination of channel/ product/ institution and hence fine tuning the selling approach focusing on the organization’s aspirations and capabilities is critical for success.

Figure 13: Implications of Distinct distribution Network 

  1. Market potential in India & abroad (Regulated & less regulated markets)

Potential for import substitution and profitable export is high

In 2019-20, India imported medical devices worth ~ Rs. 42,000 Cr.; the import dependency is as high as 86-90% for few high-end medical devices due to lack of medical grade indigenous manufacturing capacity. Imported brands like Beckton Dickinson, B Braun, Boston Scientific, Medtronic and Datwyler have high share in domestic market despite high prices, due to customer stickiness and their proven technical and manufacturing standards.

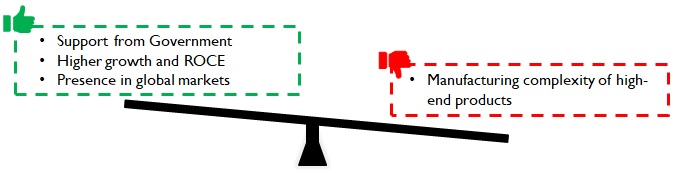
Medical devices are expected to be a flag-bearer of the Make-in-India initiative, and the Indian government is incentivising domestic manufacturing through a Rs 3,800 Cr. stimulus package. Indian manufacturers can compete with the MNC’s on cost, lower lead time and offer products that meet standards. They can establish themselves in the domestic market by initially targeting Tier 2/3 hospitals to gain brand recognition and then enter the bidding process for Tier 1 hospitals. An “invest as you earn” approach will put Indian brands on a solid path to growth and profitability as they move from import substitution to less regulated markets to regulated markets.

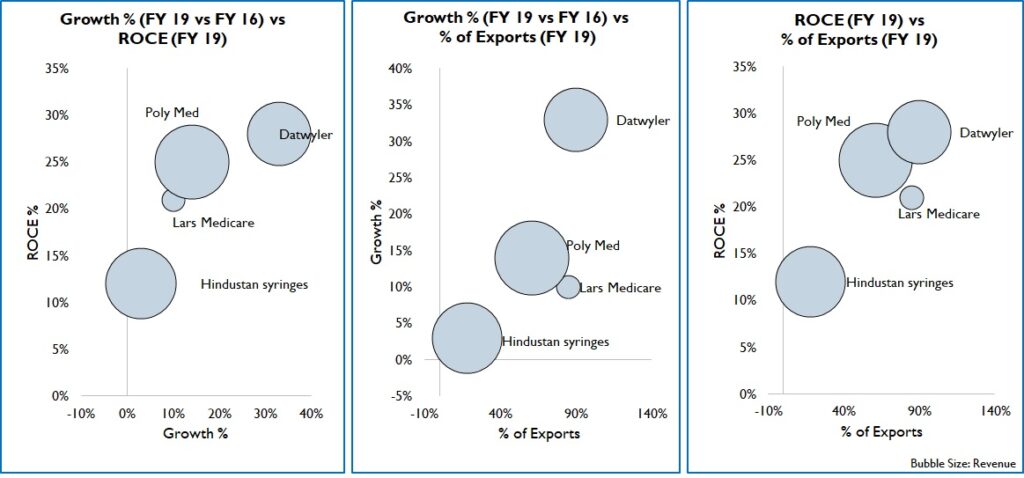
India exported Rs, 15,530 Cr. worth of medical devices in 2019, most of which were on the low-end like tubes, IV Cannulas, Breathing bags etc. These exports were to markets of Africa, Middle east, South America, and SE Asia with similar/ less stringent regulations than India. Over the years, by partnering with international healthcare NGO’s and local governments, Indian products have become widely acceptable. This is supported by good distribution network and local sales offices. Since cost is a key factor for purchase, Indian products in both high and low-end segments have good potential. Firms that target export markets can expect high growth and returns (Figure 14).

Figure 14: Comparison of Growth, Returns and Export %

A more detailed breakout of the import substitution and export market potential viewed through the lens of existing and new capabilities, product-market combinations and investment vs payback can sharpen the market entry / growth strategies of existing players and new entrants.

Figure 15: Implications of Import dependency

Conclusion

The market potential for medical devices and consumables is very high and investor interest is significant. While market size is just one axis to measure a market’s attractiveness, it is imperative to assess complexities across the value chain for entry or growth. These complexities and nuances are unique to the sector and hence a long-term play is advised – building competence and niche product capability, partnering with technical experts, creating a sustainable distribution presence, customer loyalty and keeping a good balance between domestic and exports for growth and profitability.

Authors: Samiran Das, Giridharan Raghunathan and Vasupradha Sridharan

How can the Indian API industry grow rapidly and compete in the global market?

How can the Indian API industry grow rapidly and compete in the global market? 931 616 qwixpertadmin

Executive Summary

The Indian Pharmaceutical Sector is expected to grow to Rs. 7,371 Billion by 2025 from the current Rs. 3,746 Billion (FY 20). This growth will be driven by both domestic needs and export commitments.

India exports to over 200 countries with a major share of the US generic market (40%) and the UK (25%). India also exports to countries in Africa, the EU, ASEAN, Latin America, and the Middle East. Both exports and countries exported to are expected to increase in the foreseeable future. Export of finished dosage forms (FDF) are projected to grow at ~ 8 -10% over the next decade. However, the API / intermediate sector has been stagnant for a while despite it being the starting point for the FDF sector.

The Indian Government’s healthcare expenditure has grown between 15 – 20% from 2016, currently valued at Rs. 3,316 Billion. The domestic market will remain significant as the Government boosts healthcare. Budget allocation for domestic healthcare is 1.6% of GDP and is expected to grow duet the various inclusive growth strategies.

While India’s Finished Dosage Form (FDF) manufacturing is very mature and capable, the API and intermediate sector have to regain its relevance and demonstrated capability of the past. The off-shoring of API / Intermediate manufacturing due to lower prices led to (a) the sector not keeping pace with the FDF sector, (b) low or no technology upgrades, and (c) idle capacities. Fortunately, people competence and capability are available in abundance, which can gradually but surely re-establish leadership.

The Indian Government has also set aside Rs. 100 Billion to achieve self-reliance for end-to-end development of the pharmaceutical sector and to ensure national health security for a country of 1.4 Billion.

This white paper explores a few ways to truly leverage our strengths and manage risks to realize the potential of the pharmaceutical industry (API + FDF), especially in the small and medium category.

Background

India, considered to be the pharmacy of the world, has seen an enviable growth over the last three decades and today caters to 20% of the global generics market

India has established itself as the pharmacy of the world by exporting to global markets. It ranks 3rd worldwide for production by volume and 14th by value. It supplies 20% of the demand for Generic medicines and ~62% of Vaccines.

However, the bottleneck in the Indian pharma industry is its heavy reliance on China for APIs. Following the API shortage due to Coronavirus and the subsequent supply chain disruptions, the Indian Government has announced incentives to manufacture API and KSM (Key Starting Material) domestically. We believe that the internal environment and global sentiments are perfectly aligned for India to emerge as a strong manufacturer of API for domestic and export consumption. In this white paper, we examine the API industry and recommend growth strategies for API manufacturers.

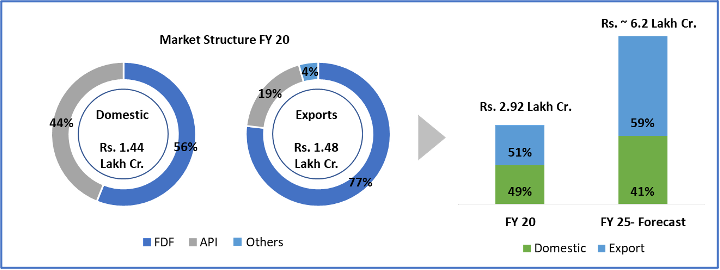
API’s are critical products in need of import substitution and restructuring measures The India pharma industry is valued at Rs. 3746 Billion (Figure 1). It consists of two complementary product segments: API and FDF. The finished dosages (FDF), which are the final products sold to customers, are prepared by combining the API with other ingredients basis the formulation. The Indian FDF industry is a highly mature segment, comprising 75% of the pharma industry and with a significant export presence.

Figure 1: Indian Pharma Market Structure (FY 20)

The global API market is valued at Rs. 12,470 Billion and India is the third-largest producer, preceded by China and the USA. India plays in the high value- low volume market comprising of high potency APIs for regulated markets. Firms like Divi, Jubilant, and Shilpa have product-level leadership in global markets for a few niche APIs.

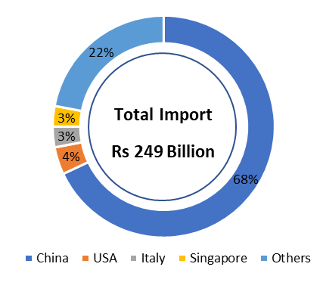
Despite the domestic manufacturing set up, Indian drug manufacturers rely on China for ~70% of API requirements (Figure 2). China has established its dominance in the market due to its cost advantage (~25% cheaper inputs), infrastructure capabilities, and chemical technology strength.

Figure 2: API dependencies of India (FY 19)

During the COVID-19 pandemic, Chinese industries were mandated into a protracted lockdown, causing the API’s supply chain disruptions. Indian drug manufacturers faced severe API shortages, with costs increasing by more than 100% for critical drugs. This highlighted the pharma industry’s risk management approach leading to precarious positions for both the country and the industry. The overdependence on China highlighted the fragility of our national health security and the industry’s business resilience.

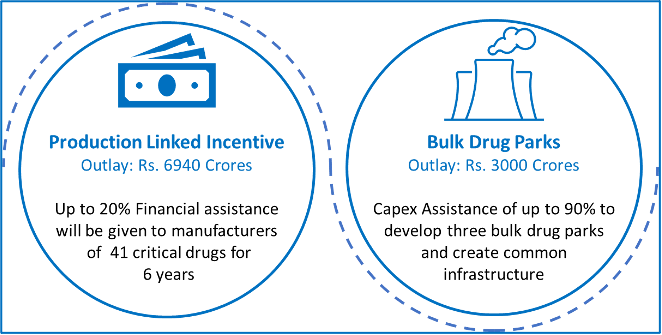
India is not alone in this realization. More and more countries are recognising this and are developing alternate sources or moving to a China+One import strategy, creating a huge opportunity for India, given her API leadership in the not too distant past. The Government of India has also identified 53 APIs for which India is dependent on China and has provided incentives to build self-reliance. The schemes include the development of three Bulk Drug Parks and a production linked incentive scheme of Rs. 6,400 Crores. With the favourable market and manufacturing landscape, the API business can be a profitable venture, and we highlight the growth strategies for pharma companies looking to develop a more resilient and sustainable API business.

I. Integration is a key to unlocking higher growth and increasing global presence

Pharma firms in India can be classified into 3 segments basis the share of API in their business.

  1. The pure-play API companies such as Divi, Solara, and Aarti Drugs generate more than 95% of their revenue from Generic and Speciality API’s sold as raw material to develop and manufacture finished drugs by local and foreign pharma companies.
  2. The second segment consists of firms with a 30-60% share of API, such as Granules, Laurus Labs, and Ipca. These firms had started in the pure-play segment and have gradually integrated across the value chains. Firms like Wanbury and Nectar also offer CRAMS services focused on developing APIs.
  3. The last segment consists of firms that earn most of their revenue from FDF business but have an API business for captive consumption and small-scale external sales; they include the likes of Cipla, Cadila, and DRL.

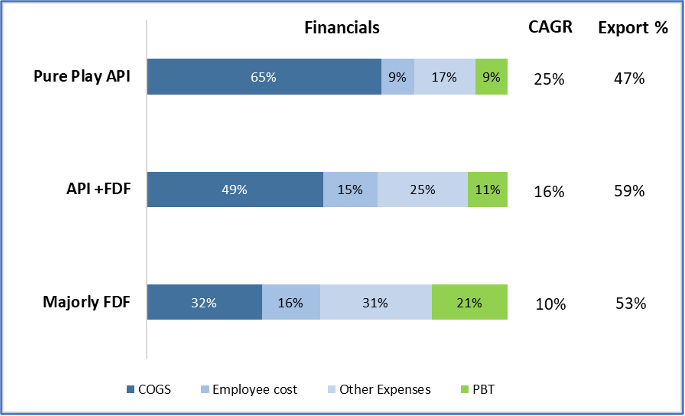
While the pure-play API segment has very grown rapidly at 25% CAGR (FY 17- 20), their profitability is low owing to the high raw material costs (Figure 3). On the other hand, FDF firms have modest growth but have remarkably high profit margins of ~21%. Vertical integration can bring the best of both pure-play segments and increase access to export markets.

Figure 3: Segment Wise financial comparison (FY 20)

API manufactures have gradually entered the formulation business. This forward integration of API firms requires initial capital outflow, but profits can increase by 200-300% and increase the scope of exports.

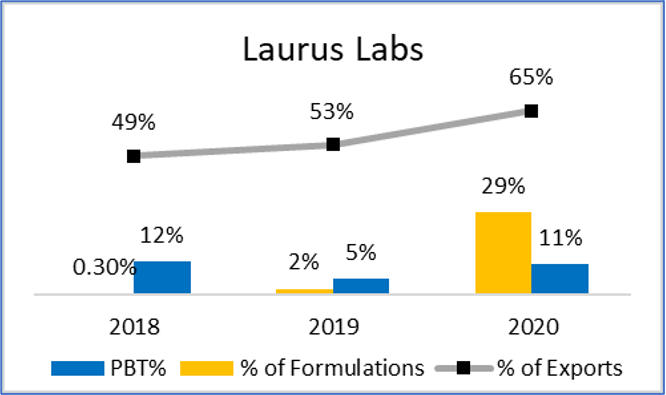
For instance, Laurus labs’ revenue share from the formulation business was 2% in 2019 and 29% in 2020 (Figure 4). While the industry’s median profit in 2020 reduced to 9% due to Coronavirus, the integration helped Laurus stabilise at 11%. Their export revenue increased from 53% to 65% in 2020. Market Cap of Laurus has increased by over 2x during this period.

Granules India has also gradually integrated across the value chain. The Market Cap of Granules has moved by almost 3x driven by the approach, among other changes in the portfolio.

Figure 4: Integration of Laurus Labs in Formulation Segment (FY 2018- FY 2020)

The pandemic has reiterated the importance of developing domestic raw material sources, and formulation manufacturers should venture into upstream integration. They can grow more rapidly by offering a combined product portfolio. The captive consumption segment accounts for ~70% of the industry demand. Companies like Cipla, Zydus Cadila, and Dr. Reddy manufacture API for internal consumption as it reduces costs, and products can be launched with greater technical certainty and better control on launch timelines. Cadila, Cipla, and DRL have lower raw material costs (26-30%) compared to the industry median of 38%.

We think the time is right for the Indian FDF companies to in-house manufacturing of portfolio critical APIs while entering into more long term, partnership-oriented (profit sharing) contracts with pure-play Indian API / KSM / ingredient players. In-housing, followed by local in-country manufacturing, will be the preferred approach going forward. This strategy will also lead to better risk management and advantaged financials for all the players.

The API and FDF industries are expected to grow even more rapidly due to the Coronavirus crises. We believe that this is an opportunity for the industry at many different levels. The global demand for paracetamols, immunity boosters, and even specialised drugs and vaccines are expected to sustain. Historically, nearly 85% of the antibiotics used in the USA are imported from China. The supply shocks from China has affected Europe and the USA, and there is potential for India to step in and export to global markets

There is scope to establish manufacturing clusters comprising of API manufacturers, Formulation manufactures and FDF manufacturers. While a cluster had been set up in Telangana in 2016, several other ventures of a much larger scale are needed in the life sciences ecosystem. Manufacturers should also enter partnerships and Joint Ventures to improve quality, widen product portfolio, and enter global markets.  For example, Zydus Takeda- a partnership between Zydus Cadila and Takeda Pharmaceutical (Japan) is a 100% export-oriented unit developing API’s and KSM’s and undertaking research in complex substances.

II. Investment in Research and Development of complex API’s will command higher premiums and provide better margins

Research and development spend is an important metric used by global customers to evaluate the performance and capability of a supplier. Indian firms with high importance to R & D makeup 46% of the overall FDA DMF approvals and received 336 ANDA approvals in 2019.

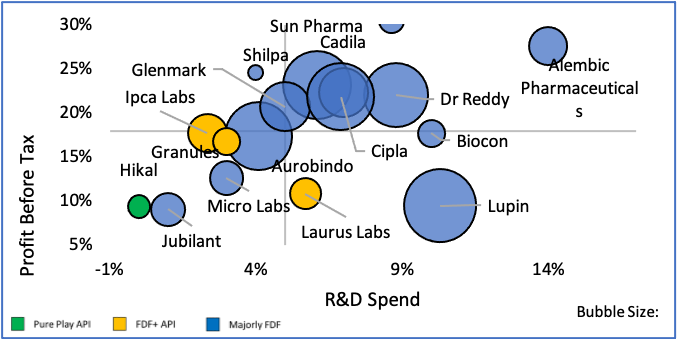
The investment in research and development can increase profitability and provide higher growth. Firms such as Dr. Reddy, Biocon, Cipla, Cadila spend 6-9% on R&D with 20-25% PBT (Figure 5).

Figure 5: Comparison of R&D Spend and Profitability (FY 20)

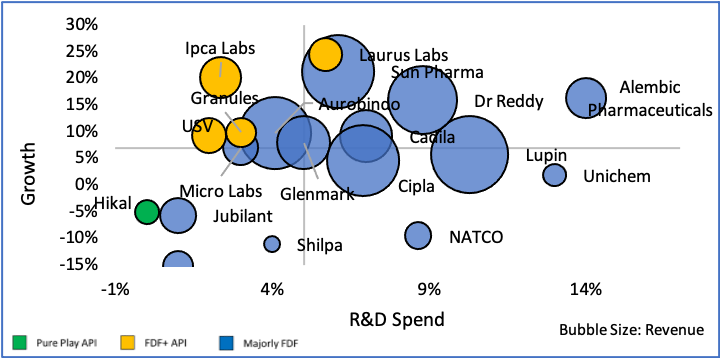
Firms that have invested in R&D have achieved a growth rate of 9% against a 4% growth rate of firms with low R&D investments (Figure 6). By investing in R&D and subsequently filing for ANDA’s and DMF’s, firms can secure their future revenue stream. Most of the firms with high R&D spend also have FDA ANDA filings for the Critical APIs (as classified by the Government of India).

Figure 6: Comparison of R&D Spend and Growth (FY 20)

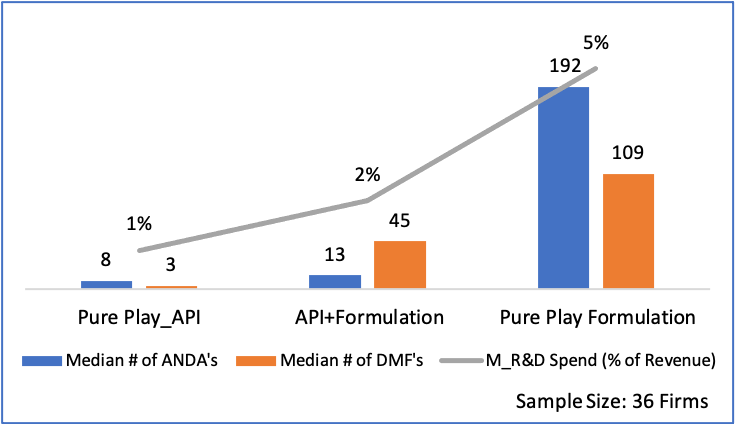
But expenditure on R&D is heavily skewed towards firms making finished dosages. Pure play API firms spend just 1% on R&D, compared to ~5% by FDF manufacturers (Figure 7). By investing in targeted product development, API firms can earn higher margins and increase growth potential. 

Figure 7: Segment-wise R&D Spend, ANDA and DMF Approval (FY 20)

API industry consists of two segments: Generics and Branded/ Innovative API. Generics consists of API’s for pain management, diabetes, cardiovascular disease; they have dominated the market with a share of 80%.

Branded/Innovative APIs are complex APIs that target niche therapeutic areas such as oncology, autoimmune and metabolic indications. It has a higher retail price and offers more lucrative margins. For instance, the API for paracetamol is $4/ kg, whereas Efavirenz, a drug to treat HIV, is priced as $95/kg in India. The cost of API’s for Innovative Drugs is 10% of the retail price as compared to 40% for generics. The branded segment is growing rapidly, and China is not considered a credible player in this segment due to competence gaps. This is a sustainable business segment for Indian API manufacturers to target.

R&D is the engine of any pharmaceutical business as it creates new products, opens up new markets, encourages new partnerships, and enhances revenue/profit growth in integrated business approaches. We believe a more internal and external collaborative approach can leverage the strength of the different stakeholders for a better return on the capital/resources deployed.

API manufacturers can collaborate with Contract research and manufacturing players (CRAMS) to pursue complex products’ research and development. It is a cost-effective solution that can reduce capital expenditure by 20-25% and offer a trained workforce.

III. Improving the manufacturing ecosystem and operational efficiency will generate a competitive advantage

The share of Chinese Imports to India was 1% in 1991 and has grown to ~70% in 2020. This rapid domination of Chinese APIs is due to the lower production cost driven by support from the state and efficient manufacturing practices.

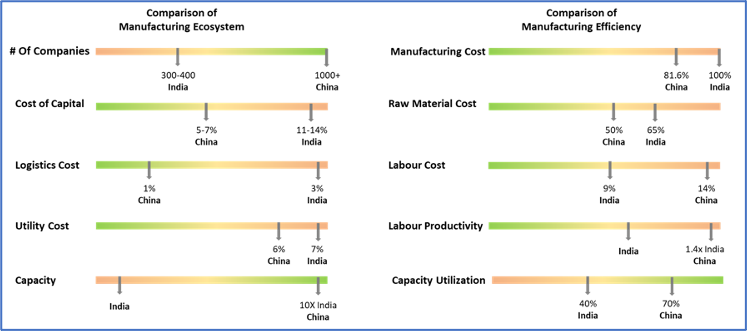
India lags China in most manufacturing parameters (Figure 8). The capacity utilization of India API units < 35%, whereas China is > 70%. All productivity parameters for India (People + Material + Time) are behind China. China has sponsored large API clusters with basic support like CETP, uninterrupted power, treated water, developed road/rail network, subsidies on utilities that reduce operating expenses. The cost of borrowing is almost twice in India, and regulatory approvals in India take ~3 times longer. The overall manufacturing cost in China is 19% less than in India.

Figure 8: Comparison of the API manufacturing ecosystem of China and India (FY 19-20)

Another concern is the availability of raw materials, lack of natural resources like Limestone, and the relative nascency of the Chemical industry that supplies raw materials to the API industry. For instance, to produce API Tenofovir, the KSM Adenine is not made in India due to high infrastructure requirements.

While India’s ecosystem has not been as conducive as China, the current Government incentives are addressing the issue. There are two aspects to the Government Incentive (Figure 9):

Figure 9: Government incentives to boost domestic API Production

The Government’s announcement towards self-reliant API and ingredient manufacturing is a great step, but implementation will be key.

There are two levers to improve profitability in the API segment: increasing utilisation rate and improving productivity.  Domestic production of key API was prevalent in pre-1991 India, and imports from China accounted for a mere ~0.3% of demand. Due to the reforms of 1991, cheaper Chinese APIs started dominating the market. There are dormant production units that can be revied and upgraded to meet the current compliance and automation standards. This can result in a 30-40% increase in the top line.

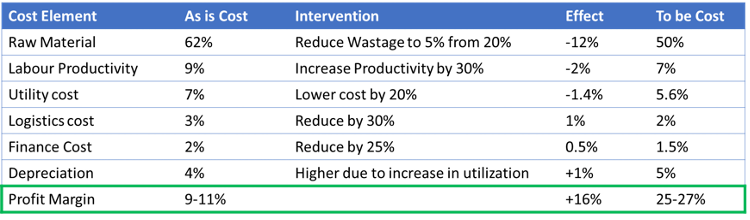
Analytics can play a significant role in improving productivity; for instance, the current rate of Raw material wastages is 20-25%; by using IoT and analytics, it can be reduced to 5%. Similarly, labour productivity and supply chain can be optimised. Firms can target a 100-200% increase in profit margins by improving operational efficiency (Figure 10).

Figure 10: Levers to improve operational efficiency and profitability (values as of FY 20)

We believe a structured and holistic approach to cost reduction and a system driven end-to-end delivery process can make the API industry (as it stands today with all the legacy issues and technology obsolescence) more efficient by ~15%. This can easily make up part of the gap with China until a more thought-through, company-specific, and the government encouraged strategy is implemented.

Furthermore, the pandemic had a direct impact on the pharma industry, throwing up gaps in markets. At the strategic level, firms can re-examine the market conditions and identify new geographies and product segments to venture into. 

Summary

As the pandemic established the importance of developing a domestic API source, the API business has high growth potential. With many countries seeking alternate API suppliers and government policies that encourage domestic manufacturing of APIs, the situation is ideal for manufactures to establish and grow in this segment. Three major growth leavers in the API market are: Integrating across the value chain, investing in research and development of Niche products, and improving operational efficiency to become cost-competitive.

About the Authors

Samiran Das, Pharmaceutical Practice Lead

Maheswaran Ganapathy

Vasupradha Sridharan