Executive summary
Very few businesses can lay claim to changing the habits of a population. Ola, with its convenient and cost-effective cabs, has changed how India travels. However, the business is yet to sustain itself financially. With the increasing customer acquisition cost for their 4W intra-city taxis and the need to turn profitable, Ola ventured into more cost-effective mobility options (carpooling, autos, 2 wheelers). Recent numbers on # of rides per day show a certain stagnation – 3.5 million/ day in 2018 vs. 3.65 million/ day in 2019. A slew of regulations issued by the Road Transport Ministry aims to limit aggregator commissions to 20%, surge pricing to 1.5X, increase formalization of the workforce (drivers), and ensure driver and rider safety. These measures squeeze Ola’s margins on either side. Hence, the road to profitability has to take two paths – premiumization of existing offerings and efficiency in operations. 4 solution themes, Driver marketplace, Electric Mobility, Strategic Partnerships, and Analytics for premiumization, present themselves. There is significant value in investing in all four, as our analysis show.
Ola’s growth is staggering with several cost elements in check or along the path; Driver expenses as a proportion of revenues are the focus for profitability
The disruption in cab-rentals in India with the arrival of Ola in 2010 and Uber a few years later is well known. Their aggregator business model with an attractive combination of convenience and economic value for riders and the driver-partners has potentially changed riding habits for generations to come. Industry estimates indicate that Ola and Uber offer ~3.65 million rides every day, i.e., more than a billion rides every year.
Billions of rides every year offered by 2.5 million driver-partners is no small achievement. But for any business to sustain, it must be profitable. A glance at the FY19 financials for ANI technologies indicates that the Operating Margin is -54% (Fig 1). A comparative analysis of the same metric in the past suggests the Operating Margin has improved from -388% in FY16. The result has come on the back of a tremendous CAGR of ~39% in revenues (Fig 1).
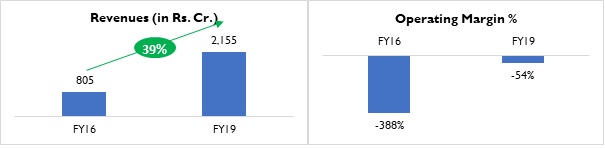
Fig 1: Revenue and Operating margin – FY19 vs. FY16
Ride-hailing services have 5 primary operating costs (Fig 2)
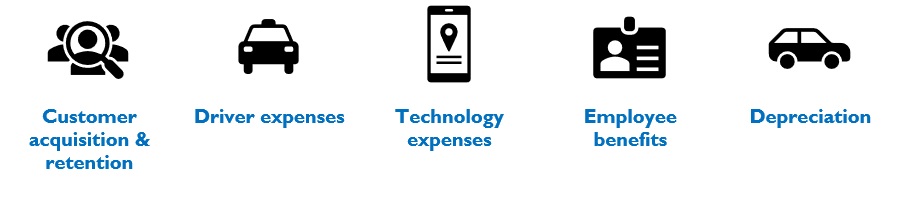
Fig 2: ANI Technologies – Key Cost elements
Qwixpert team analysed the trajectory of each of these cost components for Ola (Fig 3). Sharp decreases in all cost elements indicate significant cost-cutting and efficiency improvement measures. “Driver expenses” remain critical to profitability.
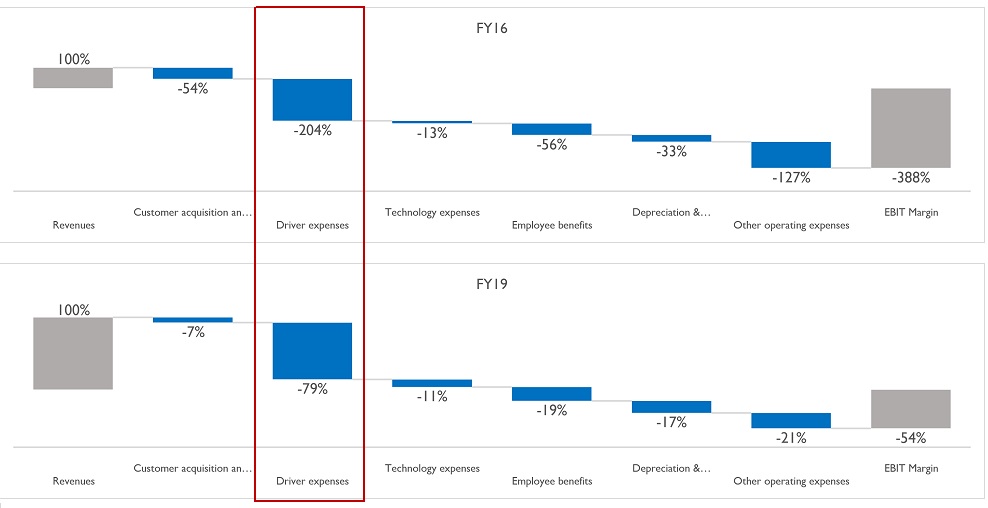
Fig 3: ANI Technologies Operating margin waterfall (all values in % of revenues) – FY19 vs. FY16
Ola, in early 2020 decided to cap driver incentives to 5% of earnings, stating that the previous system, based on trips and logins, was seen as arbitrary and not to the liking of drivers. Commissions charged by Ola (i.e., Ola’s revenues) were simultaneously capped at a fixed 20% to ensure clarity among the driver community on their estimated daily and monthly earnings. These moves have led to driver’s earning falling, leading to lower cars on the road. This move could potentially manifest into a downward spiral with lower vehicles on the road, increasing waiting times for customers and hence higher churn, further impacting driver earnings.
Regulatory oversight into ride-hailing has increased. Parliamentary panels and Road Transport ministries have acted on appeals and complaints from the driver and rider community. New guidelines issued impact current margin improvement methods. Capping surge pricing, aggregator commissions (as a % of trip revenues), and the number of driving hours per day restricts earnings potential. Compliance with guidelines of daily driver log-in hours and social security benefits to drivers will increase costs.
The most critical dilemma that ride-hailing companies are trying to solve – Increase revenues and minimize driver expenses proportionate to incomes – has become more difficult.
Qwixpert explores four potential solution themes to achieve these twin objectives
- It is time for a marketplace model for drivers, and ride-hailing companies have every incentive to enable this
It is extremely crucial to understand the earnings profile of a ride-hailing driver. Considering a city taxi in an urbanized set-up like Delhi-NCR, where the driver works for 25 days in a month and is driving ten effective hours/ day, we have estimated earnings across 4 scenarios. In each of these scenarios, no additional incentives have been considered. A 3-year loan repayment period is considered, while the resale value is not included in the business case calculations.
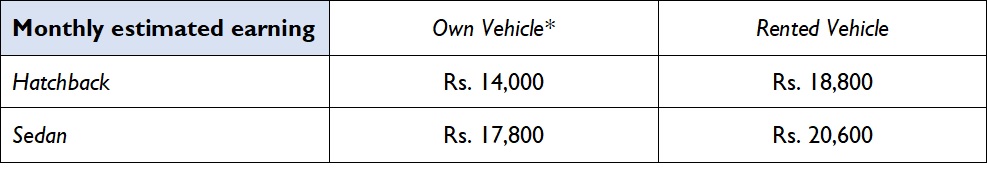
Fig 4: Monthly earnings estimate for drivers-partners (w/o incentives)
Driver availability throughout the day and across locations is a key challenge. Hence, to incentivize drivers to stay logged in for longer and take those extra rides, bonuses based on total rides/day were introduced. The incentive system is neither sustainable financially for Ola nor safe for its riders (drivers staying on the road for long hours).
Getting new drivers on board to match the aggressive growth targets is also a challenge. High sign-up bonuses encourage drivers to take vehicle loans. Many drivers are unable to pay their EMIs as their loans are from local financers, charging high-interest rates. A marketplace model (Fig 5) will be useful in such a scenario.
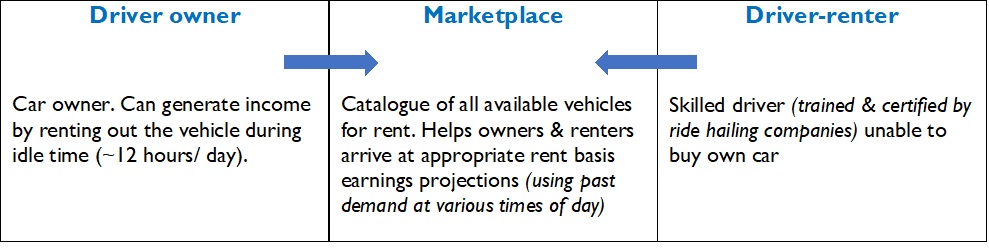
Fig 5: The marketplace model
Since Ola allows multiple driver tagging to the same Vehicle (but only one at a time), smart fleet owners already use this model to maximize asset (taxis) utilization. Concerns regarding vehicle safety can be ensured by taking a security deposit from the 2nd driver and training and certifying driver-renters using Ola Skilling. Rent and/or revenue sharing models can be estimated using analytics.
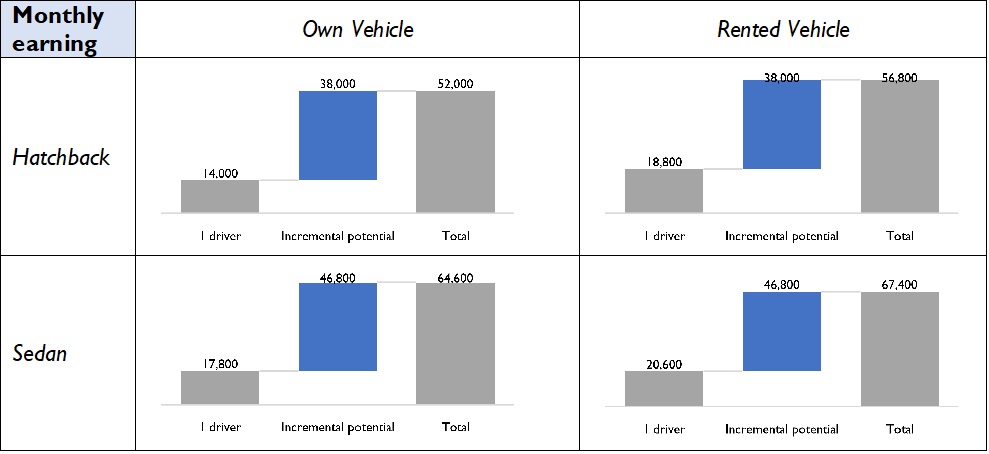
Fig 6: Monthly earnings estimates for driver-partners (w/o incentives) – 2 drivers/ car
Qwixpert estimates a 200-270% increase in monthly earnings from a car through the marketplace model (Fig 6), as fixed costs of owning a car (Eg: EMI, taxes, Insurance) get apportioned over a larger revenue base. The marketplace model is a win-win for all: consumers (higher levels of service), drivers (higher incomes), and the aggregators (increased market access and reduced incentive payments).
- Betting on Electric Vehicles and investing in them for long term
Total Cost of Ownership (TCO) analysis of EVs vs. ICEVs (Figs 8 & 9) for 4 wheelers and 2 wheelers indicates higher life-time value for the taxi segment, especially Taxis driven for longer distances every day. With the impetus from the Government to push EV adoption through subsidies, grants, and infrastructure-focused stimuli, EVs can generate significant earnings for the aggregators and the driver-partners.
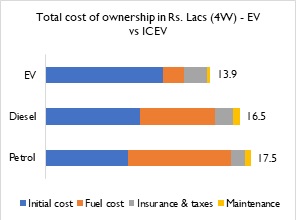
Fig 7: TCO for 4W Sedan running ~150km/ day for 3 years
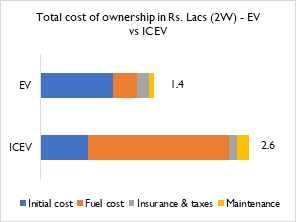
Fig 8: TCO for 2W running ~100km/ day for 3 years
Ola’s strategic investment in Ola Electric Mobility is a step in this direction. A spate of investments from existing investors (Softbank and Tiger Global) and Global Auto OEMs (Hyundai and Kia) has made Ola Electric Mobility a Unicorn in its own right. Outside of investing in an all-electric vehicle fleet of cars, 2-wheelers, and autos, Ola electric is investing in support infrastructure, i.e., battery-swapping and charging stations. EV fleet can also be integrated into the marketplace model with a substantial increase in returns.
- Strategic partnerships with select operators across the hospitality space can help tap into premium customers with increased effectiveness
There are lots of synergies to be generated from strategic partnerships with hospitality services. Meru has tied up with MakeMyTrip (Fig 9) and is jointly promoting their cabs at airports through messages and email to customers who have booked tickets on MakeMyTrip. Their prompts across communication channels help reduce the traveler’s wait time once he/she lands. This example can be extended to other aggregators such as Zomato, where a customer booking a table at their favorite restaurant can be prompted to book a cab then and there. Analytics can be leveraged to prompt the rider after a reasonable amount of time, basis the type of destination, to book the return-cab. Partnership opportunities exist with BookMyShow, Booking.com, and other services of similar nature. Swiggy has also leveraged this synergy as customers booking an order are now given the option to watch a Netflix movie trailer.
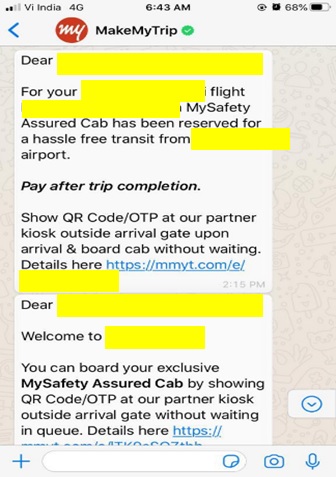
Fig 9: Meru–MakeMyTrip partnership
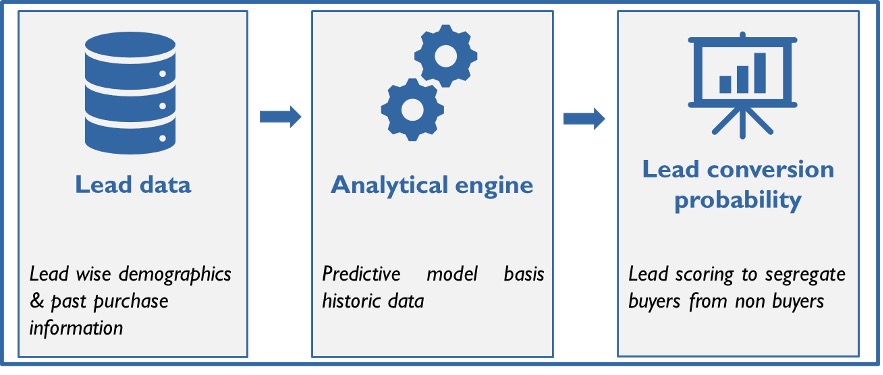
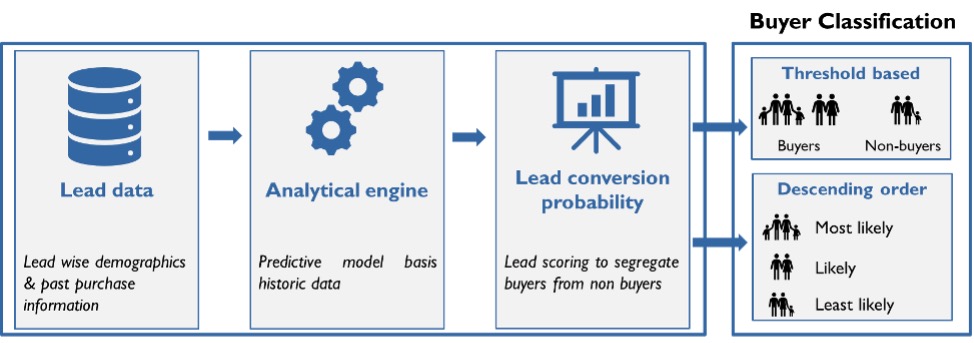
- Analytics at the front and center of revenue enhancement strategy
The alternative approach to proportionately reducing driver expenses is increasing revenues. The concept of surge pricing combines analytics with demand-supply economics. Incentivizing drivers who brave harsh weather and traffic conditions with higher fares and commanding a premium from customers for operating taxi services in such conditions are the key notions behind surge pricing. Likewise, ride-hailing services have also leveraged advanced analytics to ensure maximum driver availability at high demand routes, maximizing a driver’s earning potential and minimizing waiting times for riders. Qwixpert estimates several other applications, as below
- Customer segmentation (categorizing customers into distinct segments) basis their ride-hailing behavior – Value conscious, service-oriented, etc. can yield a plethora of business benefits
- Premiumization: Customers willing to pay a premium for higher service value can be actively encouraged to upgrade to higher-value offerings (Eg: Mini -> Prime)
- Marketing effectiveness: Incremental RoI from marketing initiatives (Eg: Coupons) to acquire new riders or encourage existing customers to ride more
- New product offerings: Frequent cancelations, surge pricing, and longer wait times lead to inferior customer experience for the office goer booking cabs every day. Meru reserve allows them to book cabs to and from the office for 30 days. Analytics helps identify and target the right customers to onboard, thereby enabling the service to scale fast. Over time, Meru can introduce carpooling services basis the office-goer demand footprint to maximize earning/ taxi and minimize carbon footprint.
- Demand forecasting analytics: Time-series analysis of booking data can help forecast potential demand from different locations at various points in time. These forecasts can help
- Re-route drivers basis demand to maximize driver earning and customer service
- Target setting for driver onboarding teams using projections of current & future driver requirements
- Build fungible driver business cases to assist driver onboarding teams
- Geographic clustering analytics categorizing various cities into clusters based on demographic and macro-economic profiles can help during expansion/ new city launches. Combining geographic clustering with demand forecasting and customer segmentation analytics can accelerate new city launches and support operational decision making (driver onboarding, marketing effectiveness, driver re-routing) in the initial phase.
Conclusion
Outlook for mobility is muted now, especially with work from home continuing to be the norm in the service sector. However, with the active COVID-19 cases falling and several vaccines showcasing promise in 3rd stage trials, vehicular movement is expected to return to pre-COVID levels soon. Ola’s dream of turning profitable may not have materialized yet, and the COVID-19 pandemic has set them back by another year, if not more. But analysis of their financials indicates that they are on the right path. Besides, recent guidelines that limit earnings and increase costs will further impact profitability. Therefore, it is critical to look at long-term initiatives that focus on leveraging operational efficiencies and premiumization of services through incremental customer value. The four solution themes discussed – driver marketplace, electric mobility, robust data analytics, and strategic partnerships – can drive these objectives and achieve sustainable profitability.
Authors
Giridharan Raghunathan and Rahul Das
Sources:
- Ministry of Corporate Affairs, India
- Ola website
- Uber Website
- Meru Website
- Society of Manufacturers of Electric Vehicles
- Kapur, Narinder (2019), ‘SoftBank fires up Ola Electric with $250 mn capital infusion’ 2-Jul. Available at: https://www.vccircle.com/softbank-fires-up-ola-electric-with-250-mn-capital-infusion/
- Bhalerao, Sheetal (2020), ‘Ola Limits Driver Incentives To 5% Of Total Earning; Commission Charged From Drivers Fixed At 20% Across India’ 8-Jan. Available at: https://trak.in/tags/business/2020/01/08/ola-limits-driver-incentives-to-5-of-total-earning-commission-charged-from-drivers-fixed-at-20-across-india/
- Shrivastava, Aditi (2019), ‘Hail no more! Ola, Uber’s ride growth slows to a crawl’, 4-Jun. Available at: https://economictimes.indiatimes.com/small-biz/startups/newsbuzz/hail-no-more-ola-ubers-ride-growth-slows-to-a-crawl/articleshow/69641990.cms
- PTI (2020), ‘MakeMyTrip ties up with Meru to offer services of sanitised cabs at major airports’ 10-Jun. Available at https://economictimes.indiatimes.com/small-biz/startups/newsbuzz/makemytrip-ties-up-with-meru-to-offer-services-of-sanitised-cabs-at-major-airports/articleshow/76302163.cms?utm_source=contentofinterest&utm_medium=text&utm_campaign=cppst
- PTI (2020), ‘Meru Cabs launches office commute service Meru Reserve with no surge pricing feature’ 15-Oct. Available at: https://www.livemint.com/companies/news/meru-cabs-launches-office-commute-service-meru-reserve-with-no-surge-pricing-feature-11602758178351.html
- Singh, Shubham (2020), “Meru Cabs Looks To Add 10,000 EVs To Fleet, Sets Course On B2B Route”, Available at: https://inc42.com/buzz/meru-cabs-looks-to-add-10000-evs-to-fleet-sets-course-on-b2b-route/
- Upadhyay, Harsh (2020), “Transport ministry issues guidelines to regulate Ola, Uber; limits surge pricing” Nov-27, Available at: https://entrackr.com/2020/11/transport-ministry-issues-guidelines-to-regulate-ola-uber/
Minchin, Joshua (2020), “Ola and Uber face new regulations in India” Nov-30, Available at: https://www.intelligenttransport.com/transport-news/112231/ola-and-uber-face-new-regulations-in-india/