Executive Summary
The Indian Pharmaceutical Sector is expected to grow to Rs. 7,371 Billion by 2025 from the current Rs. 3,746 Billion (FY 20). This growth will be driven by both domestic needs and export commitments.
India exports to over 200 countries with a major share of the US generic market (40%) and the UK (25%). India also exports to countries in Africa, the EU, ASEAN, Latin America, and the Middle East. Both exports and countries exported to are expected to increase in the foreseeable future. Export of finished dosage forms (FDF) are projected to grow at ~ 8 -10% over the next decade. However, the API / intermediate sector has been stagnant for a while despite it being the starting point for the FDF sector.
The Indian Government’s healthcare expenditure has grown between 15 – 20% from 2016, currently valued at Rs. 3,316 Billion. The domestic market will remain significant as the Government boosts healthcare. Budget allocation for domestic healthcare is 1.6% of GDP and is expected to grow duet the various inclusive growth strategies.
While India’s Finished Dosage Form (FDF) manufacturing is very mature and capable, the API and intermediate sector have to regain its relevance and demonstrated capability of the past. The off-shoring of API / Intermediate manufacturing due to lower prices led to (a) the sector not keeping pace with the FDF sector, (b) low or no technology upgrades, and (c) idle capacities. Fortunately, people competence and capability are available in abundance, which can gradually but surely re-establish leadership.
The Indian Government has also set aside Rs. 100 Billion to achieve self-reliance for end-to-end development of the pharmaceutical sector and to ensure national health security for a country of 1.4 Billion.
This white paper explores a few ways to truly leverage our strengths and manage risks to realize the potential of the pharmaceutical industry (API + FDF), especially in the small and medium category.
Background
India, considered to be the pharmacy of the world, has seen an enviable growth over the last three decades and today caters to 20% of the global generics market
India has established itself as the pharmacy of the world by exporting to global markets. It ranks 3rd worldwide for production by volume and 14th by value. It supplies 20% of the demand for Generic medicines and ~62% of Vaccines.
However, the bottleneck in the Indian pharma industry is its heavy reliance on China for APIs. Following the API shortage due to Coronavirus and the subsequent supply chain disruptions, the Indian Government has announced incentives to manufacture API and KSM (Key Starting Material) domestically. We believe that the internal environment and global sentiments are perfectly aligned for India to emerge as a strong manufacturer of API for domestic and export consumption. In this white paper, we examine the API industry and recommend growth strategies for API manufacturers.
API’s are critical products in need of import substitution and restructuring measures The India pharma industry is valued at Rs. 3746 Billion (Figure 1). It consists of two complementary product segments: API and FDF. The finished dosages (FDF), which are the final products sold to customers, are prepared by combining the API with other ingredients basis the formulation. The Indian FDF industry is a highly mature segment, comprising 75% of the pharma industry and with a significant export presence.
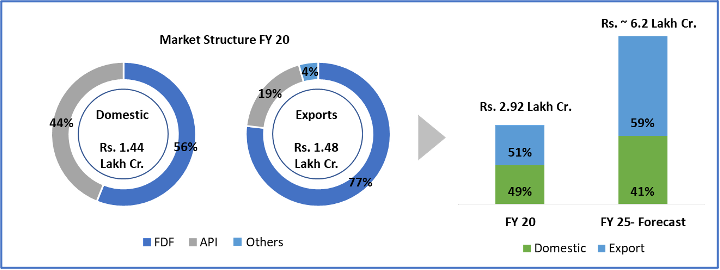
Figure 1: Indian Pharma Market Structure (FY 20)
The global API market is valued at Rs. 12,470 Billion and India is the third-largest producer, preceded by China and the USA. India plays in the high value- low volume market comprising of high potency APIs for regulated markets. Firms like Divi, Jubilant, and Shilpa have product-level leadership in global markets for a few niche APIs.
Despite the domestic manufacturing set up, Indian drug manufacturers rely on China for ~70% of API requirements (Figure 2). China has established its dominance in the market due to its cost advantage (~25% cheaper inputs), infrastructure capabilities, and chemical technology strength.
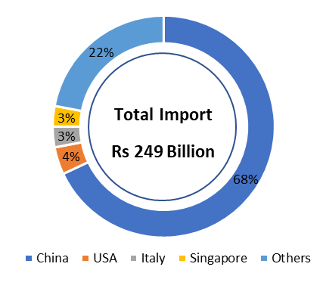
Figure 2: API dependencies of India (FY 19)
During the COVID-19 pandemic, Chinese industries were mandated into a protracted lockdown, causing the API’s supply chain disruptions. Indian drug manufacturers faced severe API shortages, with costs increasing by more than 100% for critical drugs. This highlighted the pharma industry’s risk management approach leading to precarious positions for both the country and the industry. The overdependence on China highlighted the fragility of our national health security and the industry’s business resilience.
India is not alone in this realization. More and more countries are recognising this and are developing alternate sources or moving to a China+One import strategy, creating a huge opportunity for India, given her API leadership in the not too distant past. The Government of India has also identified 53 APIs for which India is dependent on China and has provided incentives to build self-reliance. The schemes include the development of three Bulk Drug Parks and a production linked incentive scheme of Rs. 6,400 Crores. With the favourable market and manufacturing landscape, the API business can be a profitable venture, and we highlight the growth strategies for pharma companies looking to develop a more resilient and sustainable API business.
I. Integration is a key to unlocking higher growth and increasing global presence
Pharma firms in India can be classified into 3 segments basis the share of API in their business.
- The pure-play API companies such as Divi, Solara, and Aarti Drugs generate more than 95% of their revenue from Generic and Speciality API’s sold as raw material to develop and manufacture finished drugs by local and foreign pharma companies.
- The second segment consists of firms with a 30-60% share of API, such as Granules, Laurus Labs, and Ipca. These firms had started in the pure-play segment and have gradually integrated across the value chains. Firms like Wanbury and Nectar also offer CRAMS services focused on developing APIs.
- The last segment consists of firms that earn most of their revenue from FDF business but have an API business for captive consumption and small-scale external sales; they include the likes of Cipla, Cadila, and DRL.
While the pure-play API segment has very grown rapidly at 25% CAGR (FY 17- 20), their profitability is low owing to the high raw material costs (Figure 3). On the other hand, FDF firms have modest growth but have remarkably high profit margins of ~21%. Vertical integration can bring the best of both pure-play segments and increase access to export markets.
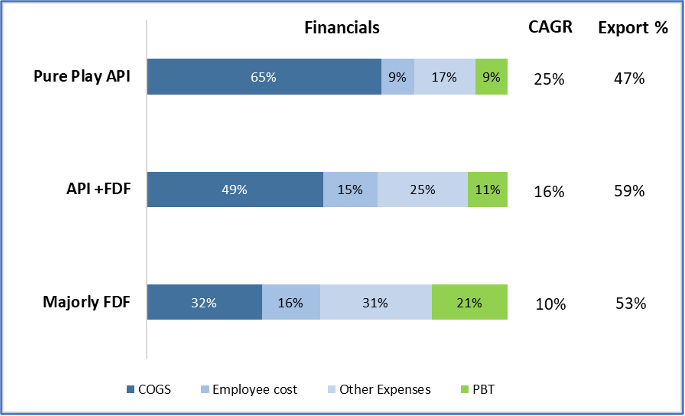
Figure 3: Segment Wise financial comparison (FY 20)
API manufactures have gradually entered the formulation business. This forward integration of API firms requires initial capital outflow, but profits can increase by 200-300% and increase the scope of exports.
For instance, Laurus labs’ revenue share from the formulation business was 2% in 2019 and 29% in 2020 (Figure 4). While the industry’s median profit in 2020 reduced to 9% due to Coronavirus, the integration helped Laurus stabilise at 11%. Their export revenue increased from 53% to 65% in 2020. Market Cap of Laurus has increased by over 2x during this period.
Granules India has also gradually integrated across the value chain. The Market Cap of Granules has moved by almost 3x driven by the approach, among other changes in the portfolio.
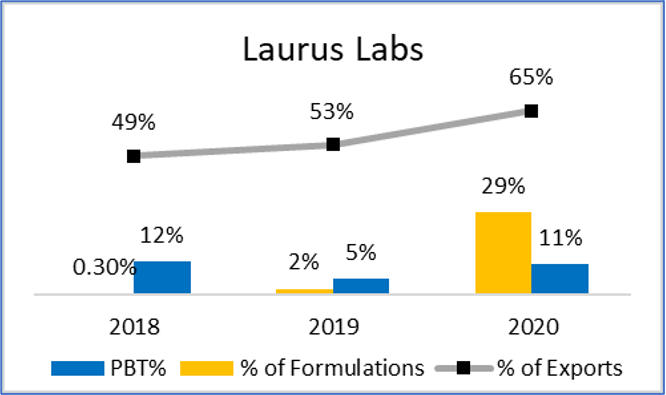
Figure 4: Integration of Laurus Labs in Formulation Segment (FY 2018- FY 2020)
The pandemic has reiterated the importance of developing domestic raw material sources, and formulation manufacturers should venture into upstream integration. They can grow more rapidly by offering a combined product portfolio. The captive consumption segment accounts for ~70% of the industry demand. Companies like Cipla, Zydus Cadila, and Dr. Reddy manufacture API for internal consumption as it reduces costs, and products can be launched with greater technical certainty and better control on launch timelines. Cadila, Cipla, and DRL have lower raw material costs (26-30%) compared to the industry median of 38%.
We think the time is right for the Indian FDF companies to in-house manufacturing of portfolio critical APIs while entering into more long term, partnership-oriented (profit sharing) contracts with pure-play Indian API / KSM / ingredient players. In-housing, followed by local in-country manufacturing, will be the preferred approach going forward. This strategy will also lead to better risk management and advantaged financials for all the players.
The API and FDF industries are expected to grow even more rapidly due to the Coronavirus crises. We believe that this is an opportunity for the industry at many different levels. The global demand for paracetamols, immunity boosters, and even specialised drugs and vaccines are expected to sustain. Historically, nearly 85% of the antibiotics used in the USA are imported from China. The supply shocks from China has affected Europe and the USA, and there is potential for India to step in and export to global markets
There is scope to establish manufacturing clusters comprising of API manufacturers, Formulation manufactures and FDF manufacturers. While a cluster had been set up in Telangana in 2016, several other ventures of a much larger scale are needed in the life sciences ecosystem. Manufacturers should also enter partnerships and Joint Ventures to improve quality, widen product portfolio, and enter global markets. For example, Zydus Takeda- a partnership between Zydus Cadila and Takeda Pharmaceutical (Japan) is a 100% export-oriented unit developing API’s and KSM’s and undertaking research in complex substances.
II. Investment in Research and Development of complex API’s will command higher premiums and provide better margins
Research and development spend is an important metric used by global customers to evaluate the performance and capability of a supplier. Indian firms with high importance to R & D makeup 46% of the overall FDA DMF approvals and received 336 ANDA approvals in 2019.
The investment in research and development can increase profitability and provide higher growth. Firms such as Dr. Reddy, Biocon, Cipla, Cadila spend 6-9% on R&D with 20-25% PBT (Figure 5).
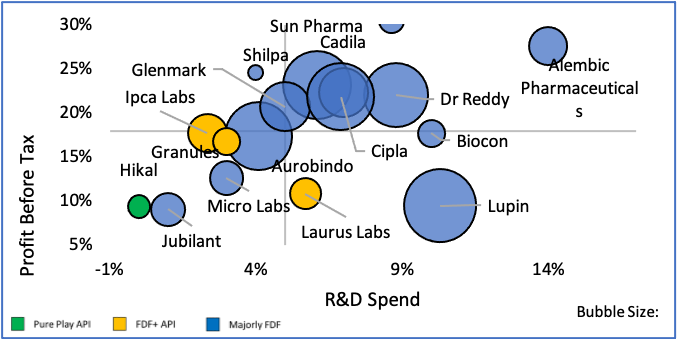
Figure 5: Comparison of R&D Spend and Profitability (FY 20)
Firms that have invested in R&D have achieved a growth rate of 9% against a 4% growth rate of firms with low R&D investments (Figure 6). By investing in R&D and subsequently filing for ANDA’s and DMF’s, firms can secure their future revenue stream. Most of the firms with high R&D spend also have FDA ANDA filings for the Critical APIs (as classified by the Government of India).
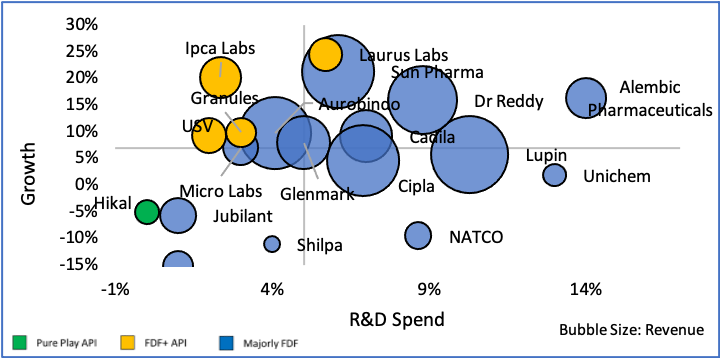
Figure 6: Comparison of R&D Spend and Growth (FY 20)
But expenditure on R&D is heavily skewed towards firms making finished dosages. Pure play API firms spend just 1% on R&D, compared to ~5% by FDF manufacturers (Figure 7). By investing in targeted product development, API firms can earn higher margins and increase growth potential.
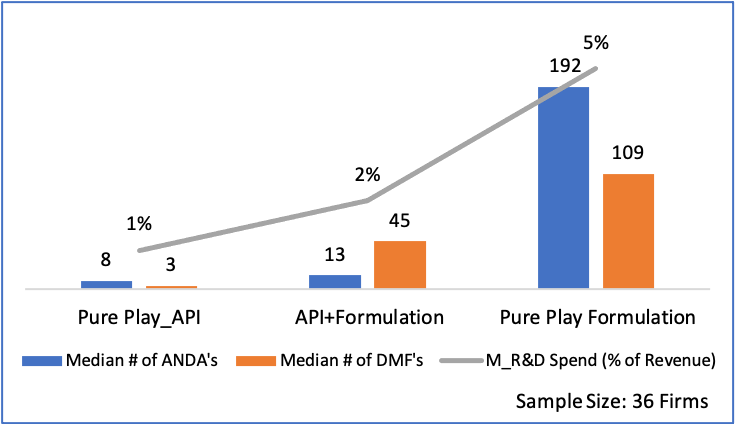
Figure 7: Segment-wise R&D Spend, ANDA and DMF Approval (FY 20)
API industry consists of two segments: Generics and Branded/ Innovative API. Generics consists of API’s for pain management, diabetes, cardiovascular disease; they have dominated the market with a share of 80%.
Branded/Innovative APIs are complex APIs that target niche therapeutic areas such as oncology, autoimmune and metabolic indications. It has a higher retail price and offers more lucrative margins. For instance, the API for paracetamol is $4/ kg, whereas Efavirenz, a drug to treat HIV, is priced as $95/kg in India. The cost of API’s for Innovative Drugs is 10% of the retail price as compared to 40% for generics. The branded segment is growing rapidly, and China is not considered a credible player in this segment due to competence gaps. This is a sustainable business segment for Indian API manufacturers to target.
R&D is the engine of any pharmaceutical business as it creates new products, opens up new markets, encourages new partnerships, and enhances revenue/profit growth in integrated business approaches. We believe a more internal and external collaborative approach can leverage the strength of the different stakeholders for a better return on the capital/resources deployed.
API manufacturers can collaborate with Contract research and manufacturing players (CRAMS) to pursue complex products’ research and development. It is a cost-effective solution that can reduce capital expenditure by 20-25% and offer a trained workforce.
III. Improving the manufacturing ecosystem and operational efficiency will generate a competitive advantage
The share of Chinese Imports to India was 1% in 1991 and has grown to ~70% in 2020. This rapid domination of Chinese APIs is due to the lower production cost driven by support from the state and efficient manufacturing practices.
India lags China in most manufacturing parameters (Figure 8). The capacity utilization of India API units < 35%, whereas China is > 70%. All productivity parameters for India (People + Material + Time) are behind China. China has sponsored large API clusters with basic support like CETP, uninterrupted power, treated water, developed road/rail network, subsidies on utilities that reduce operating expenses. The cost of borrowing is almost twice in India, and regulatory approvals in India take ~3 times longer. The overall manufacturing cost in China is 19% less than in India.
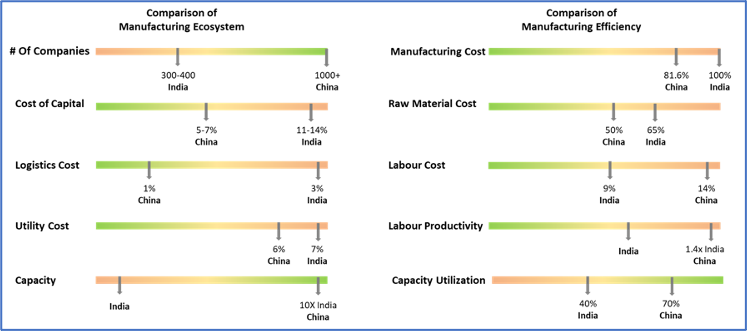
Figure 8: Comparison of the API manufacturing ecosystem of China and India (FY 19-20)
Another concern is the availability of raw materials, lack of natural resources like Limestone, and the relative nascency of the Chemical industry that supplies raw materials to the API industry. For instance, to produce API Tenofovir, the KSM Adenine is not made in India due to high infrastructure requirements.
While India’s ecosystem has not been as conducive as China, the current Government incentives are addressing the issue. There are two aspects to the Government Incentive (Figure 9):
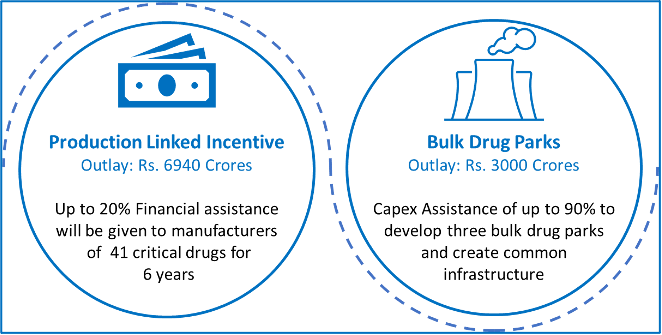
Figure 9: Government incentives to boost domestic API Production
The Government’s announcement towards self-reliant API and ingredient manufacturing is a great step, but implementation will be key.
There are two levers to improve profitability in the API segment: increasing utilisation rate and improving productivity. Domestic production of key API was prevalent in pre-1991 India, and imports from China accounted for a mere ~0.3% of demand. Due to the reforms of 1991, cheaper Chinese APIs started dominating the market. There are dormant production units that can be revied and upgraded to meet the current compliance and automation standards. This can result in a 30-40% increase in the top line.
Analytics can play a significant role in improving productivity; for instance, the current rate of Raw material wastages is 20-25%; by using IoT and analytics, it can be reduced to 5%. Similarly, labour productivity and supply chain can be optimised. Firms can target a 100-200% increase in profit margins by improving operational efficiency (Figure 10).
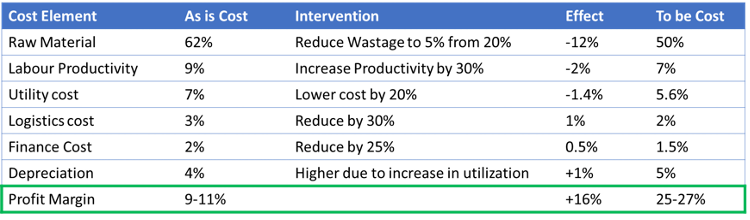
Figure 10: Levers to improve operational efficiency and profitability (values as of FY 20)
We believe a structured and holistic approach to cost reduction and a system driven end-to-end delivery process can make the API industry (as it stands today with all the legacy issues and technology obsolescence) more efficient by ~15%. This can easily make up part of the gap with China until a more thought-through, company-specific, and the government encouraged strategy is implemented.
Furthermore, the pandemic had a direct impact on the pharma industry, throwing up gaps in markets. At the strategic level, firms can re-examine the market conditions and identify new geographies and product segments to venture into.
Summary
As the pandemic established the importance of developing a domestic API source, the API business has high growth potential. With many countries seeking alternate API suppliers and government policies that encourage domestic manufacturing of APIs, the situation is ideal for manufactures to establish and grow in this segment. Three major growth leavers in the API market are: Integrating across the value chain, investing in research and development of Niche products, and improving operational efficiency to become cost-competitive.
About the Authors
Samiran Das, Pharmaceutical Practice Lead
Maheswaran Ganapathy
Vasupradha Sridharan