| Executive Summary As FMCG companies expand across general trade, modern trade, e-commerce, quick commerce, and D2C channels, inventory is increasingly being distributed across more nodes, locations, and fulfilment models. The result is a paradox: despite carrying higher overall inventory, companies often struggle to maintain product availability. This fragmentation reduces inventory pooling benefits, increases stock imbalances, and creates simultaneous situations of excess stock in one location and stock-outs in another. Traditional inventory planning approaches are often unable to keep pace with the complexity. Improving availability today requires smarter inventory positioning, dynamic replenishment and network-wide visibility, not simply holding more stock. |
A supply chain leader recently shared a frustration that is becoming increasingly common across consumer industries. “Over the last two years, inventory had increased significantly. Warehouses were fuller, working capital was under pressure, and inventory carrying costs were rising. Yet service levels were not improving. Stock-outs continued on key e-commerce platforms, quick commerce fill rates remained inconsistent, and customers were still complaining about product availability.”
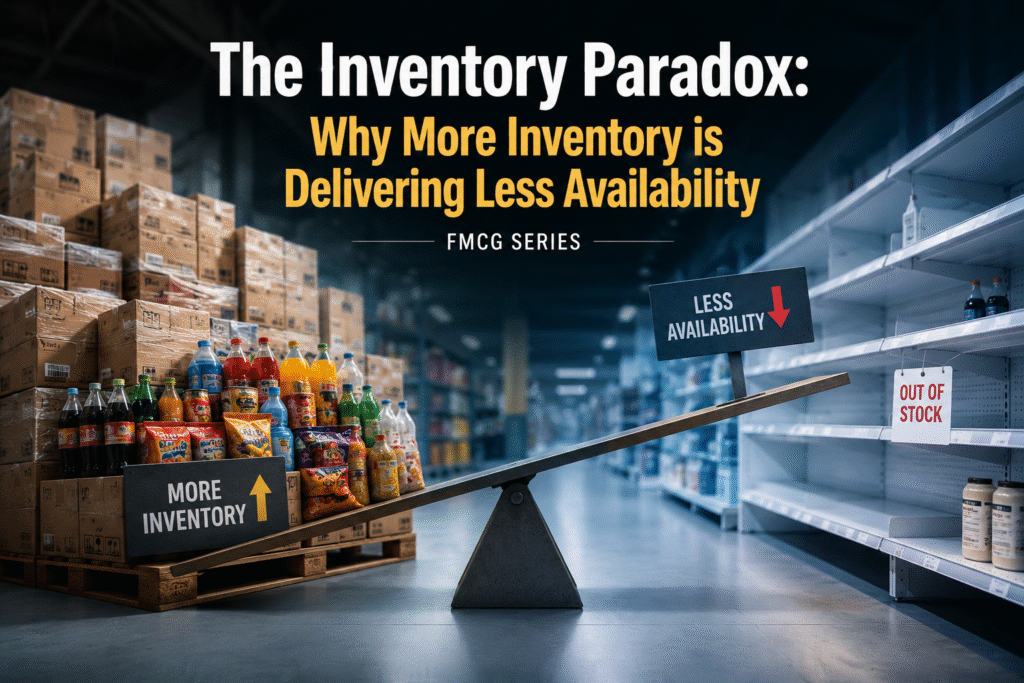
At first glance, this appears contradictory. Conventional supply chain wisdom suggests that more inventory should improve service levels. However, many FMCG, retail, and consumer goods companies are discovering that the relationship between inventory and availability is no longer as straightforward as it once was. The reason lies in a phenomenon that is becoming increasingly prevalent across modern supply chains: inventory fragmentation.
When Inventory Was Simpler
Historically, FMCG supply chains operated through relatively straightforward distribution structures. Products moved from manufacturing plants to regional warehouses, then to distributors and retailers. Inventory was concentrated within a limited number of nodes, and distributors absorbed a significant portion of demand variability and inventory risk.
Under this model, increasing inventory often improved service levels. The inventory was pooled, visible, and relatively easy to deploy where needed. The mathematics of inventory pooling worked in the industry’s favour. A single inventory pool serving multiple customers required less safety stock than multiple independent inventory pools. As a result, organisations could improve availability without proportionately increasing inventory.
That logic is now being challenged.
The Rise of Inventory Fragmentation
The rapid growth of e-commerce marketplaces, quick commerce platforms, B2B e-commerce networks, and Direct-to-Consumer (DTC) channels has fundamentally altered how inventory is deployed.
Inventory is no longer concentrated within a few warehouses and distributor locations. Instead, it is spread across a growing network of fulfilment centres, dark stores, partner distribution centres, and channel-specific inventory pools.
The same SKU may simultaneously exist in:
- General Trade distribution networks
- Modern Trade distribution centres
- Marketplace fulfilment centres
- Quick commerce partner warehouses
- Dark stores
- DTC fulfilment centres
- Third-party logistics facilities
While overall inventory may be increasing, the inventory available to serve a specific demand signal may actually be declining. This creates what many organisations are experiencing today: rising inventory coupled with stagnant or deteriorating service levels.
Understanding the Four Dimensions of Inventory Fragmentation
Inventory fragmentation extends beyond physical stock location. In practice, it manifests in four distinct ways.
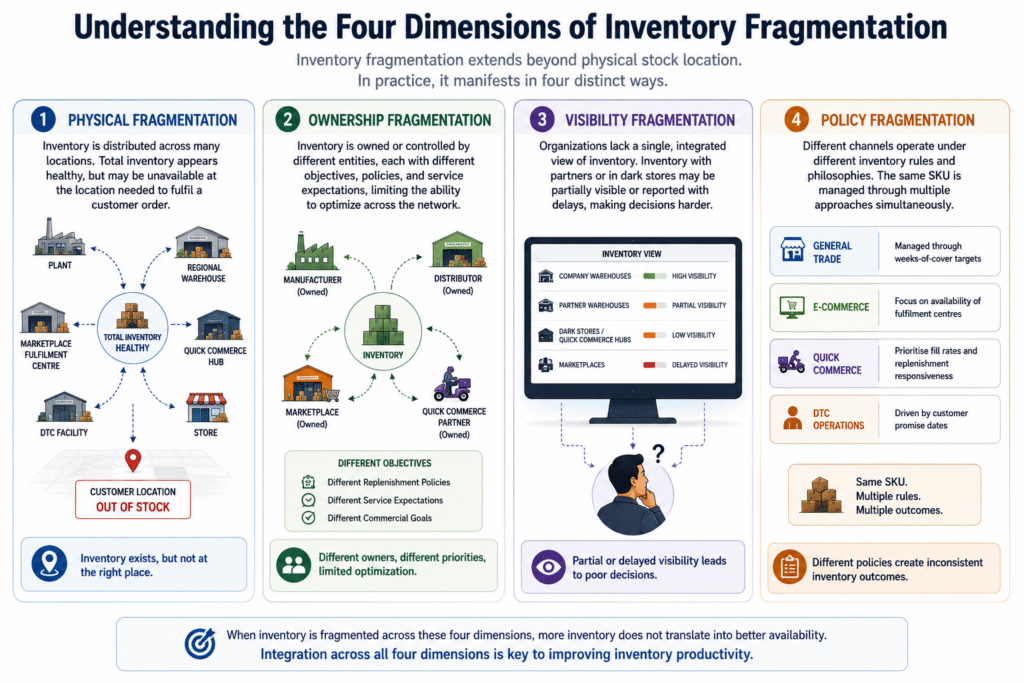
1. Physical Fragmentation
The most visible form of fragmentation occurs when inventory is distributed across a large number of locations. A company may hold inventory across plants, regional warehouses, marketplace fulfilment centres, quick commerce hubs, and DTC facilities. While total inventory appears healthy, the inventory required to fulfil a specific customer order may be unavailable at the relevant location.
2. Ownership Fragmentation
Not all inventory is owned or controlled by the same entity. Some inventory may be owned by distributors, marketplaces, quick-commerce partners, or the manufacturer itself. Each stakeholder operates under different objectives, replenishment policies, and service expectations. As ownership becomes fragmented, so does the ability to optimize inventory across the network.
3. Visibility Fragmentation
Many organizations still lack a single, integrated view of inventory. Inventory within company-owned warehouses may be highly visible, while inventory within partner networks, dark stores, or marketplaces may only be partially visible or reported with significant delays. Decision-making becomes increasingly difficult when planners cannot see the entire inventory landscape.
4. Policy Fragmentation
Perhaps the most overlooked challenge is that different channels operate under different inventory rules. General Trade may be managed through weeks-of-cover targets. E-commerce platforms may focus on the availability of fulfilment centres. Quick commerce players prioritise fill rates and replenishment responsiveness. DTC operations are driven by customer promise dates. The same SKU is therefore managed through multiple inventory philosophies simultaneously.
Why More Inventory Often Fails to Solve the Problem
When service levels decline, many organisations instinctively increase inventory. Unfortunately, fragmented supply chains often convert this additional inventory into additional inefficiency rather than additional availability.
Consider a simple example. Inventory may be abundant within the General Trade network while a marketplace fulfilment centre experiences stock-outs. From an enterprise perspective, inventory exists. From the customer’s perspective, the product is unavailable. Similarly, inventory may be trapped within one quick commerce platform while another experiences shortage. Products may be available in one region but unavailable in another. Excess inventory may coexist alongside lost sales.
The issue is not inventory sufficiency. It is inventory placement. This distinction is becoming increasingly important as channels proliferate and customer expectations continue to rise.
From Inventory Planning to Inventory Orchestration
Many organisations still approach inventory management as a planning problem. The primary question remains: “How much inventory should we carry?”
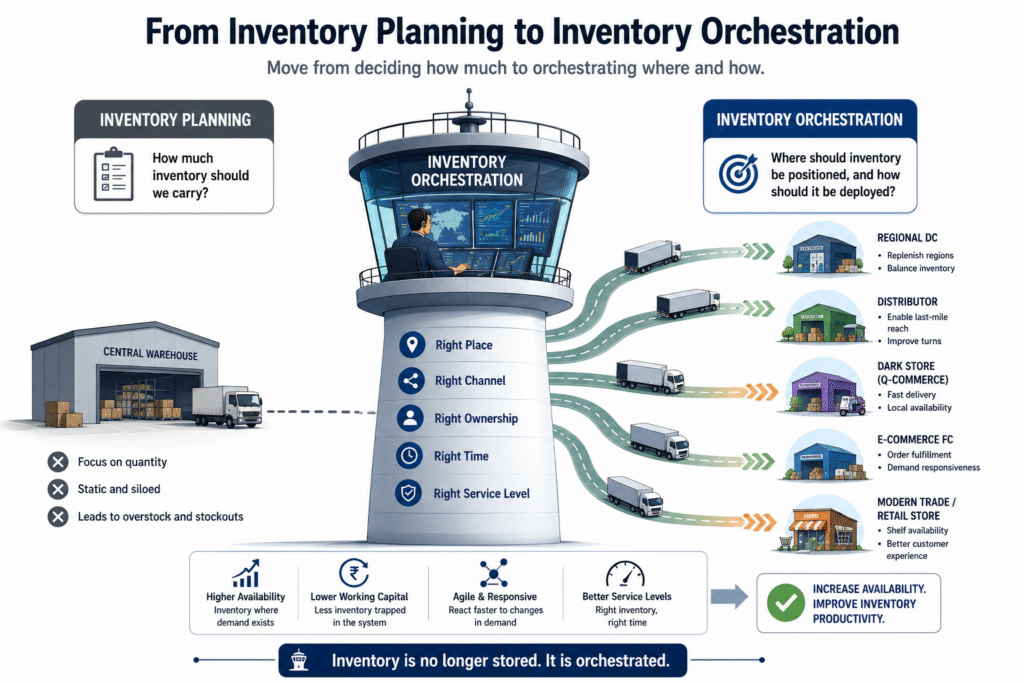
An increasingly important question is emerging: “Where should inventory be positioned, and how should it be deployed?” This represents a shift from inventory planning to inventory orchestration. Inventory orchestration focuses on coordinating inventory across locations, channels, ownership structures, and service requirements. The objective is not simply to increase stock levels, but to improve inventory productivity.
Organisations that excel at inventory orchestration are able to balance availability and working capital simultaneously, rather than trading one against the other.
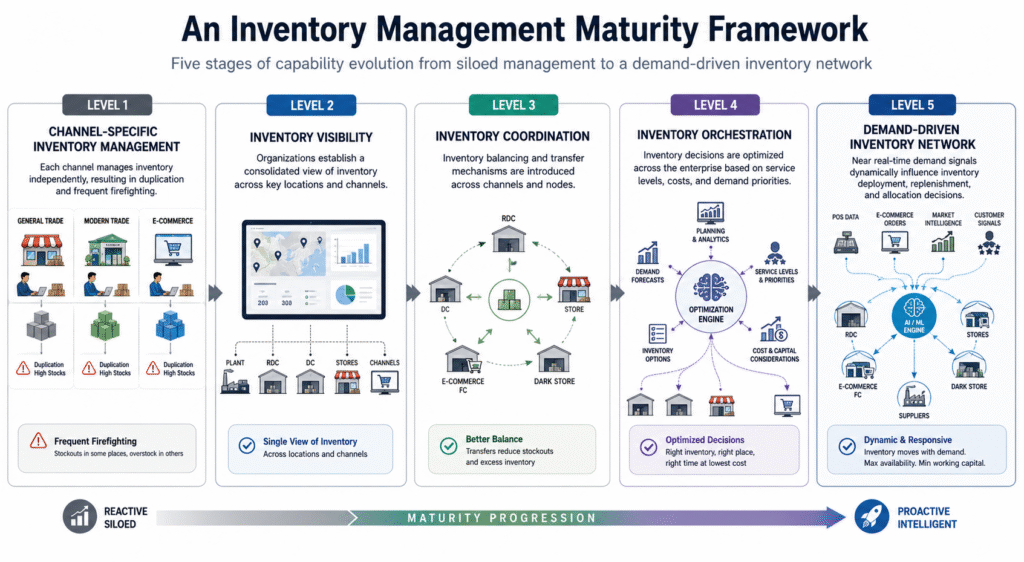
An Inventory Management Maturity Framework
As organisations evolve their inventory capabilities, they typically move through five stages.
Level 1: Channel-Specific Inventory Management
Each channel manages inventory independently, resulting in duplication and frequent firefighting.
Level 2: Inventory Visibility
Organizations establish a consolidated view of inventory across key locations and channels.
Level 3: Inventory Coordination
Inventory balancing and transfer mechanisms are introduced across channels and nodes.
Level 4: Inventory Orchestration
Inventory decisions are optimized across the enterprise based on service levels, costs, and demand priorities.
Level 5: Demand-Driven Inventory Network
Near real-time demand signals dynamically influence inventory deployment, replenishment, and allocation decisions.
Few organizations have reached the highest levels of maturity, but many are beginning to recognize the need to move beyond traditional inventory planning approaches.
What We Commonly Observe
Across FMCG, food and beverages, personal care, retail, fashion, consumer durables, and aftermarket sectors, a recurring pattern emerges. Inventory growth frequently outpaces sales growth. Service challenges persist despite rising inventory investment. Different channels maintain separate inventory buffers. Visibility remains fragmented. Inventory transfer decisions are often slow and reactive. Most importantly, organizations continue attempting to solve availability problems by adding inventory rather than improving inventory deployment. This approach becomes increasingly expensive as channels proliferate.
Conclusion
The challenge facing modern supply chains is no longer inventory sufficiency. It is inventory placement. As new-age channels continue to grow, inventory will inevitably become more distributed, more fragmented, and more difficult to manage. Organizations that continue to address service challenges by simply adding inventory will find themselves carrying higher working capital with diminishing returns.
The leaders of the future will be those who can orchestrate inventory across channels, locations, ownership structures, and service requirements—delivering higher availability with lower inventory investment.
In an omni-channel world, competitive advantage comes not from holding more inventory, but from deploying inventory more intelligently.