
Dairy

Beyond ABC Analysis: Managing the Long Tail in an Omni-Channel World

Beyond ABC Analysis: Managing the Long Tail in an Omni-Channel World

Beyond ABC Analysis: Managing the Long Tail in an Omni-Channel World 1536 1024 qwixpertadmin

A common complaint among FMCG supply chain leaders today sounds something like this:

“Our inventory is higher than ever, warehouse space is under pressure, and yet we continue to face stock-outs on key digital channels.”

At first glance, these issues appear unrelated. However, in many organisations, they stem from the same underlying challenge: the growing long tail of SKUs created by e-commerce marketplaces, quick commerce, and Direct-to-Consumer (DTC) channels.

For decades, FMCG supply chains were built around a relatively concentrated product portfolio. General Trade (GT) and Modern Trade (MT) naturally filtered assortments. Shelf space was limited, distributors focused on fast-moving products, and planning teams could concentrate on a manageable set of high-volume SKUs.

The emergence of digital channels has changed that equation. Every flavour, pack size, variant, bundle, gift pack, regional assortment, and limited-edition product can now be listed online. Consumers expect choice, and digital platforms reward breadth of assortment. As a result, SKU counts have grown significantly across many FMCG categories.

The challenge is that while the revenue opportunity from the long tail is real, managing these SKUs using traditional planning and inventory policies can create substantial operational and financial inefficiencies.

The Problem is Not the Long Tail

Many organisations respond to growing SKU complexity by launching SKU rationalisation exercises. While rationalisation has its place, it is often an incomplete solution.

Not every low-volume SKU is a bad SKU. Some products play an important role in attracting consumers to digital platforms. Others serve niche but profitable customer segments. Certain SKUs support premium positioning, seasonal campaigns, or new product launches. Eliminating them purely because they have lower volumes may hurt growth more than it helps efficiency.

The real problem is not the existence of long-tail SKUs. The problem is managing them using the same planning, sourcing, inventory, and service policies as fast movers. In other words, the future of long-tail management is not aggressive SKU reduction. It is differentiated management.

Why Traditional ABC Analysis is No Longer Enough

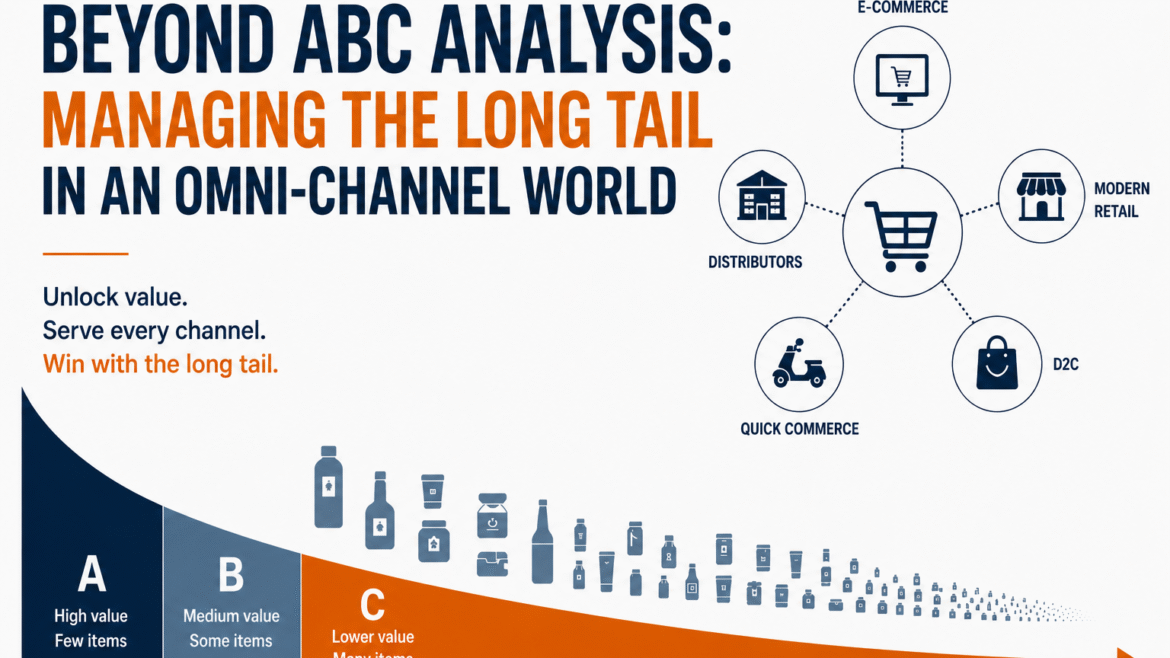
Most supply chains still rely heavily on ABC analysis: Fast movers become A-items, Medium movers become B-items, and Slow movers become C-items.

While useful, this approach was designed for a simpler world. Today’s omni-channel environment requires a richer understanding of SKU behaviour. A slow-moving SKU can still be strategically important. A seasonal product may have low annual volume but extremely high demand concentration during specific periods. A marketplace-exclusive pack may contribute little revenue but help improve search visibility and consumer acquisition. Treating all slow-moving products the same often leads to poor decisions.

Traditional ABC analysis answers only one question: How much does a SKU sell? Unfortunately, modern supply chains need to answer several additional questions. Is demand predictable? Is the SKU strategically important? Does it carry high obsolescence risk? Does it move frequently enough to justify frequent replenishment? These questions require a broader classification framework than sales volume alone.

A More Practical Framework for Long-Tail Management

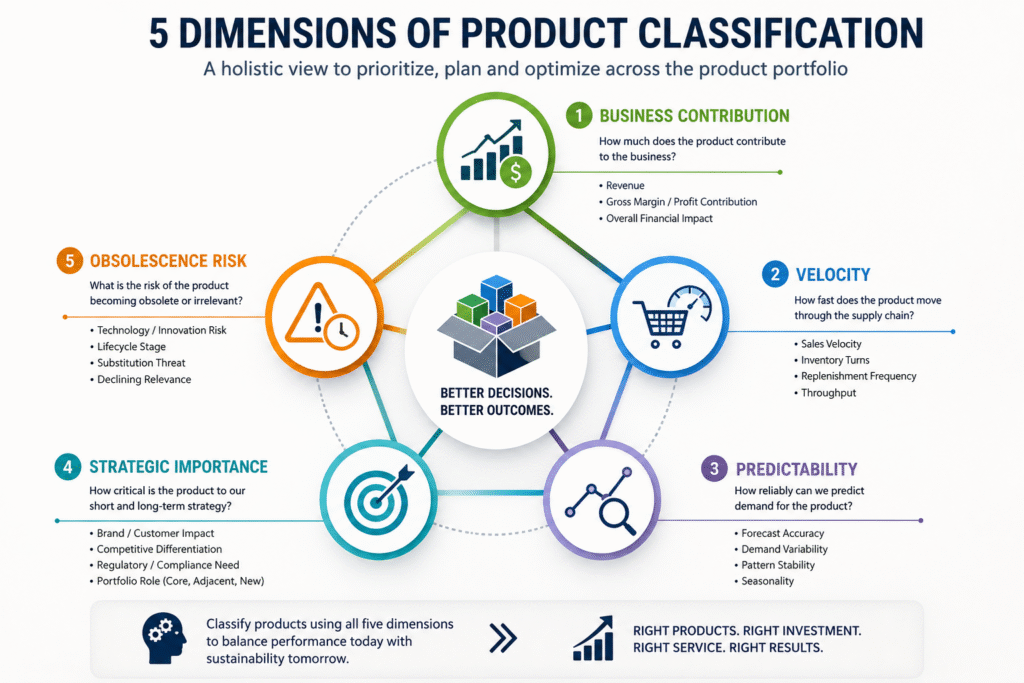
Instead of classifying products solely by volume, organisations should evaluate SKUs across five dimensions.

1. Business Contribution

How much does the SKU contribute to the revenue? This is a traditional ABC Pareto analysis, with A, B, and C category SKUs contributing 80%, 15%, and 5% of revenue, respectively. This classification helps the planner identify the SKUs that drive sales. The exact cut-off could be modified to 60-30-10 or 70-20-10 depending on the business. In some of the businesses, profit contribution is considered instead of revenue.

2. Velocity

How quickly does the SKU move? Velocity is usually measured using the frequency of the orders. Another term the industry uses is “runner,” “repeater,” or “stranger.” This remains important because velocity directly influences inventory turns, replenishment frequency, and warehouse handling requirements.

3. Predictability

How stable is demand? This is measured by the uniformity of the orders throughout the year. Some products exhibit consistent demand patterns while others are highly seasonal, promotion-driven, or event-driven. SKUs could be classified as regular, irregular, seasonal, or sporadic. Similarly, if the SKU is forecastable or non-forecastable. Two SKUs with identical annual volumes may require completely different inventory policies if their demand profiles differ.

4. Strategic Importance

What role does the SKU play in the portfolio? Certain products may be critical despite low sales volumes. Examples include premium variants, marketplace exclusives, hero products, or strategic new launches. Revenue contribution alone does not determine business importance. Often, there are flagship products that define the company’s competitive position. Sometimes, the product needs to be planned as part of portfolio completion.

5. Obsolescence Risk

How likely is inventory to become unsellable? This is particularly relevant in FMCG categories with shelf-life constraints. Low-velocity products with short shelf life require very different planning policies than low-velocity products with long shelf life.

These five dimensions create a more meaningful basis for segmentation and decision-making than traditional ABC analysis alone.

The Hidden Cost of Long-Tail SKUs 

One of the most common mistakes organisations make is focusing exclusively on procurement economics. 

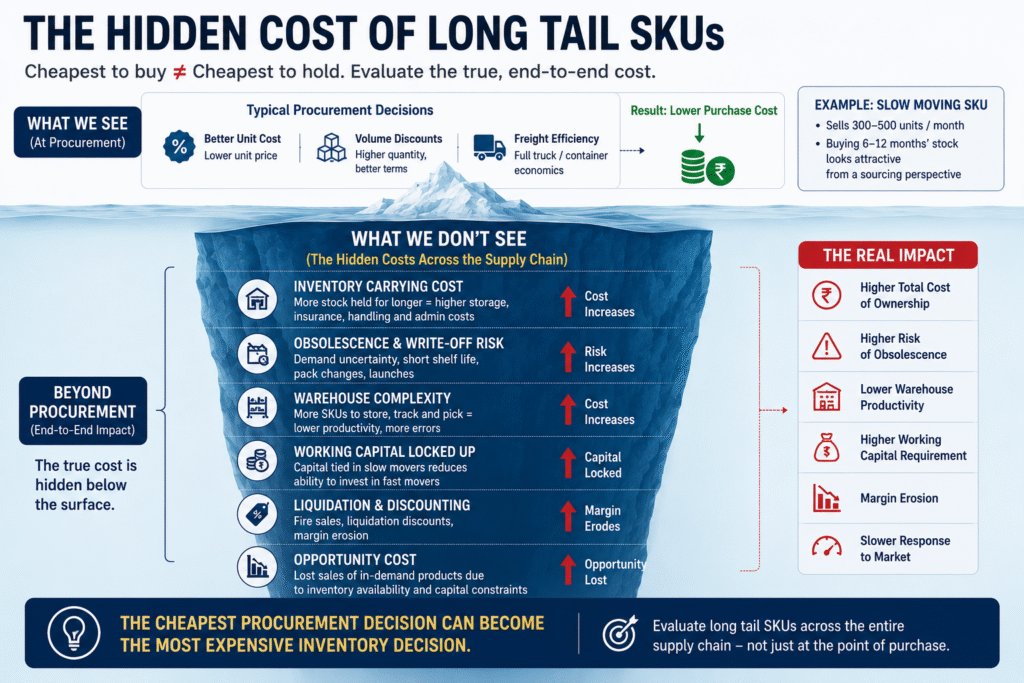
Procurement teams often seek larger purchase quantities to improve unit costs, secure volume discounts, or optimise freight economics. While this may reduce purchase costs, it can significantly increase inventory carrying costs, obsolescence risk, warehouse complexity, and working capital requirements. 

In many situations, the cheapest procurement decision becomes the most expensive inventory decision. In many situations, the cheapest procurement decision becomes the most expensive inventory decision.

Purchasing six or twelve months of inventory may appear attractive from a sourcing perspective. However, the resulting inventory exposure can lead to write-offs, liquidation discounts, excess warehouse occupancy, and capital locked in stock that may never be sold. 

Every additional long-tail SKU also consumes planning bandwidth through forecasting, exception management, parameter maintenance and master data administration. 


The economics of long-tail products must therefore be evaluated across the entire supply chain rather than within procurement alone.

Different SKUs Require Different Service Levels

Another common practice is applying similar service targets across the portfolio. Many organisations target 95% availability for virtually all products. While appropriate for core fast-moving products, this approach often creates unnecessary inventory investment for long-tail items.

Service levels should not be determined by sales volume alone. They should reflect the product’s business contribution, lifecycle stage, strategic importance and channel role.

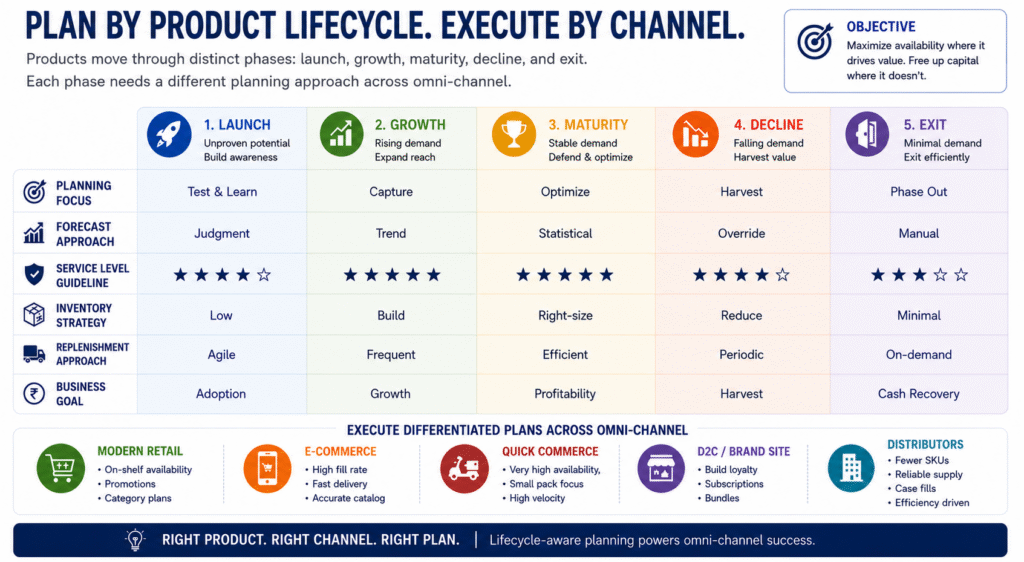
A more effective approach is differentiated service management. Core products may warrant service levels above 90-95%. Growth products may require 95–98%. Strategic niche products may operate at slightly lower levels. Low-priority long-tail products may justify even more selective inventory policies. The product on exit will not even have service level targets and probably will have as low as 30-50% service levels. The objective is not to reduce service indiscriminately. It is to align service expectations with business value.

Lifecycle Management Matters

Perhaps the most overlooked aspect of long-tail management is lifecycle tracking. Products move through distinct phases: launch, growth, maturity, decline, and exit. Yet many organizations continue using the same planning parameters throughout the product’s life.

As products mature and demand patterns change, inventory policies, service levels, replenishment frequencies, and sourcing strategies should evolve accordingly. Lifecycle-driven planning helps organizations reduce obsolescence risk while maintaining availability where it matters most.

Lifecycle transitions should automatically trigger changes in planning parameters rather than relying on manual planner intervention.

What We Commonly Observe 

Across consumer goods, food and beverage, personal care, retail, fashion, and consumer durables sectors, a recurring pattern emerges. Although the exact numbers vary, we frequently observe that roughly 20–25% of SKUs generate most of the revenue, while the remaining long tail drives a disproportionate share of inventory, planning effort and warehouse complexity. 

However, the answer is rarely wholesale rationalisation. Organisations that achieve the best results are those that develop differentiated policies for different SKU segments balancing availability, working capital, service, and profitability according to the characteristics of each product. 

Conclusion 

The growth of e-commerce, quick commerce, and DTC channels has made the long tail a permanent feature of the modern FMCG landscape. Consumers expect choice, and digital platforms reward breadth of assortment. The question is no longer whether organisations should carry long-tail SKUs. The question is how intelligently they manage them. 

The future belongs to companies that move beyond traditional ABC analysis and adopt differentiated approaches to inventory, sourcing, service levels, and lifecycle management. Competitive advantage in an omni-channel world will not come from carrying fewer SKUs. It will come from understanding which SKUs deserve different supply chain policies—and having the discipline to execute them consistently. 

About the Authors

Qwixpert is a boutique management consulting firm focused on building Future-Fit Supply Chains. The firm works with organisations across consumer goods, retail, fashion, industrial products, and aftermarket sectors to improve agility, inventory productivity, fulfilment performance, and supply chain decision-making.

Through more than 100 consulting engagements across 16 industries, the team has observed how digital channels, changing consumer behaviour, and rising service expectations are redefining the role of supply chains.

This article is part of a broader series exploring the implications of these shifts in trade channels and the capabilities organisations need to build for the future.

Inventory Management

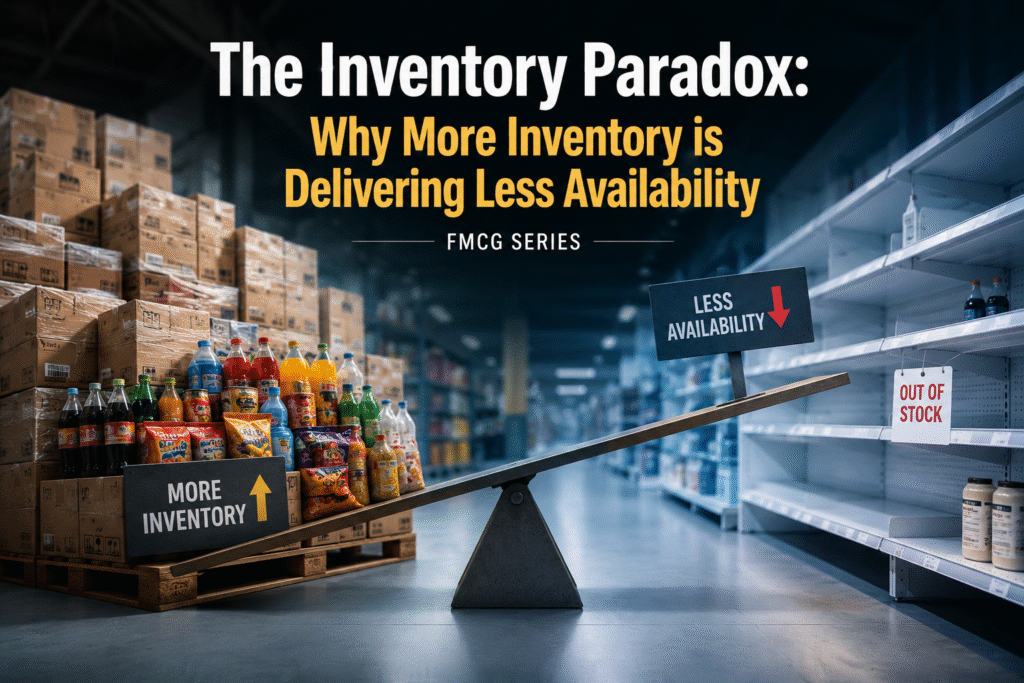
The Inventory Paradox: Why More Inventory is Delivering Less Availability

The Inventory Paradox: Why More Inventory is Delivering Less Availability 2560 1440 qwixpertadmin
Executive Summary

As FMCG companies expand across general trade, modern trade, e-commerce, quick commerce, and D2C channels, inventory is increasingly being distributed across more nodes, locations, and fulfilment models. The result is a paradox: despite carrying higher overall inventory, companies often struggle to maintain product availability.
This fragmentation reduces inventory pooling benefits, increases stock imbalances, and creates simultaneous situations of excess stock in one location and stock-outs in another. Traditional inventory planning approaches are often unable to keep pace with the complexity.
Improving availability today requires smarter inventory positioning, dynamic replenishment and network-wide visibility, not simply holding more stock.

A supply chain leader recently shared a frustration that is becoming increasingly common across consumer industries. “Over the last two years, inventory had increased significantly. Warehouses were fuller, working capital was under pressure, and inventory carrying costs were rising. Yet service levels were not improving. Stock-outs continued on key e-commerce platforms, quick commerce fill rates remained inconsistent, and customers were still complaining about product availability.”

Inventory Management

At first glance, this appears contradictory. Conventional supply chain wisdom suggests that more inventory should improve service levels. However, many FMCG, retail, and consumer goods companies are discovering that the relationship between inventory and availability is no longer as straightforward as it once was. The reason lies in a phenomenon that is becoming increasingly prevalent across modern supply chains: inventory fragmentation.

When Inventory Was Simpler

Historically, FMCG supply chains operated through relatively straightforward distribution structures. Products moved from manufacturing plants to regional warehouses, then to distributors and retailers. Inventory was concentrated within a limited number of nodes, and distributors absorbed a significant portion of demand variability and inventory risk.

Under this model, increasing inventory often improved service levels. The inventory was pooled, visible, and relatively easy to deploy where needed. The mathematics of inventory pooling worked in the industry’s favour. A single inventory pool serving multiple customers required less safety stock than multiple independent inventory pools. As a result, organisations could improve availability without proportionately increasing inventory.

That logic is now being challenged.

The Rise of Inventory Fragmentation

The rapid growth of e-commerce marketplaces, quick commerce platforms, B2B e-commerce networks, and Direct-to-Consumer (DTC) channels has fundamentally altered how inventory is deployed.

Inventory is no longer concentrated within a few warehouses and distributor locations. Instead, it is spread across a growing network of fulfilment centres, dark stores, partner distribution centres, and channel-specific inventory pools.

The same SKU may simultaneously exist in:

  • General Trade distribution networks
  • Modern Trade distribution centres
  • Marketplace fulfilment centres
  • Quick commerce partner warehouses
  • Dark stores
  • DTC fulfilment centres
  • Third-party logistics facilities

While overall inventory may be increasing, the inventory available to serve a specific demand signal may actually be declining. This creates what many organisations are experiencing today: rising inventory coupled with stagnant or deteriorating service levels.

Understanding the Four Dimensions of Inventory Fragmentation

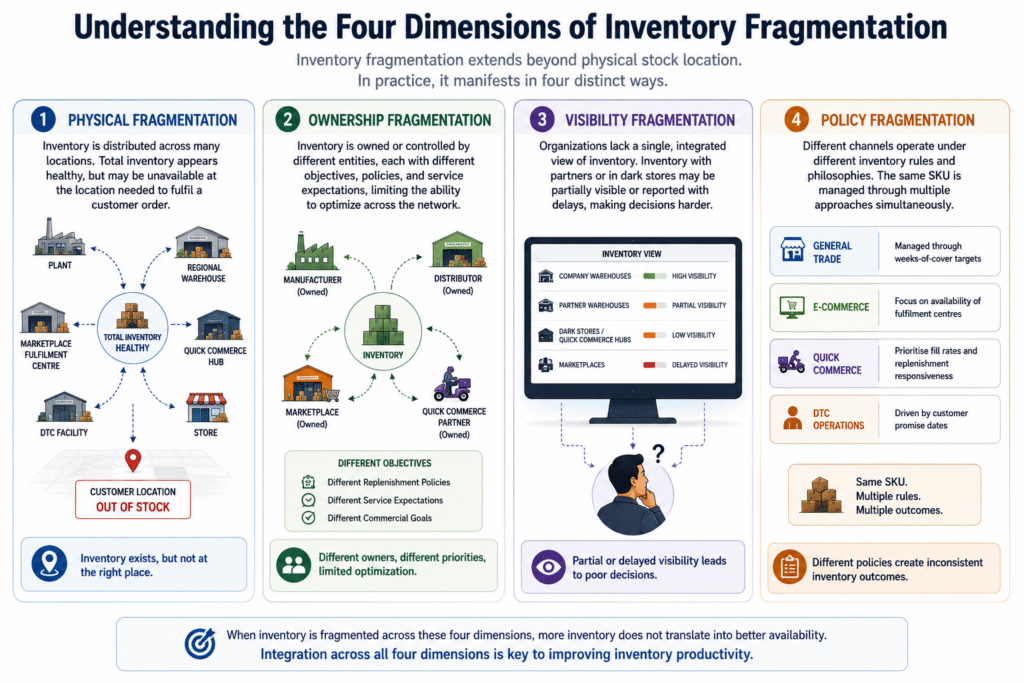
Inventory fragmentation extends beyond physical stock location. In practice, it manifests in four distinct ways.

Understanding the Four Dimensions of Inventory Fragmentation

1. Physical Fragmentation

The most visible form of fragmentation occurs when inventory is distributed across a large number of locations. A company may hold inventory across plants, regional warehouses, marketplace fulfilment centres, quick commerce hubs, and DTC facilities. While total inventory appears healthy, the inventory required to fulfil a specific customer order may be unavailable at the relevant location.

2. Ownership Fragmentation

Not all inventory is owned or controlled by the same entity. Some inventory may be owned by distributors, marketplaces, quick-commerce partners, or the manufacturer itself. Each stakeholder operates under different objectives, replenishment policies, and service expectations. As ownership becomes fragmented, so does the ability to optimize inventory across the network.

3. Visibility Fragmentation

Many organizations still lack a single, integrated view of inventory. Inventory within company-owned warehouses may be highly visible, while inventory within partner networks, dark stores, or marketplaces may only be partially visible or reported with significant delays. Decision-making becomes increasingly difficult when planners cannot see the entire inventory landscape.

4. Policy Fragmentation

Perhaps the most overlooked challenge is that different channels operate under different inventory rules. General Trade may be managed through weeks-of-cover targets. E-commerce platforms may focus on the availability of fulfilment centres. Quick commerce players prioritise fill rates and replenishment responsiveness. DTC operations are driven by customer promise dates. The same SKU is therefore managed through multiple inventory philosophies simultaneously.

Why More Inventory Often Fails to Solve the Problem

When service levels decline, many organisations instinctively increase inventory. Unfortunately, fragmented supply chains often convert this additional inventory into additional inefficiency rather than additional availability.

Consider a simple example. Inventory may be abundant within the General Trade network while a marketplace fulfilment centre experiences stock-outs. From an enterprise perspective, inventory exists. From the customer’s perspective, the product is unavailable. Similarly, inventory may be trapped within one quick commerce platform while another experiences shortage. Products may be available in one region but unavailable in another. Excess inventory may coexist alongside lost sales.

The issue is not inventory sufficiency. It is inventory placement. This distinction is becoming increasingly important as channels proliferate and customer expectations continue to rise.

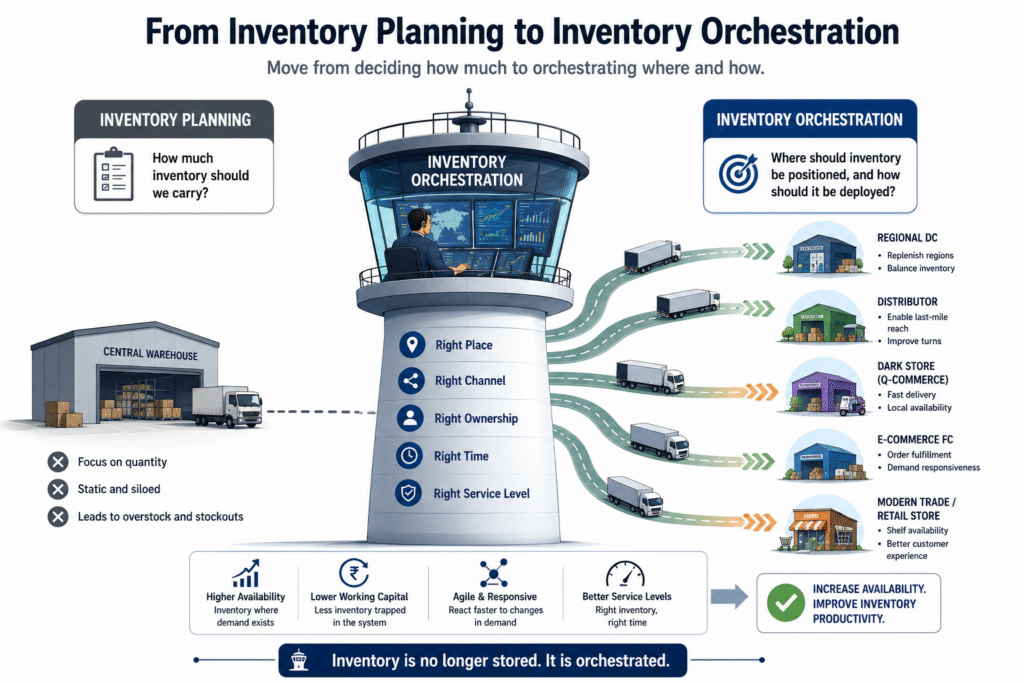
From Inventory Planning to Inventory Orchestration

Many organisations still approach inventory management as a planning problem. The primary question remains: “How much inventory should we carry?”

From Inventory Planning to Inventory Orchestration

An increasingly important question is emerging: “Where should inventory be positioned, and how should it be deployed?” This represents a shift from inventory planning to inventory orchestration. Inventory orchestration focuses on coordinating inventory across locations, channels, ownership structures, and service requirements. The objective is not simply to increase stock levels, but to improve inventory productivity.

Organisations that excel at inventory orchestration are able to balance availability and working capital simultaneously, rather than trading one against the other.

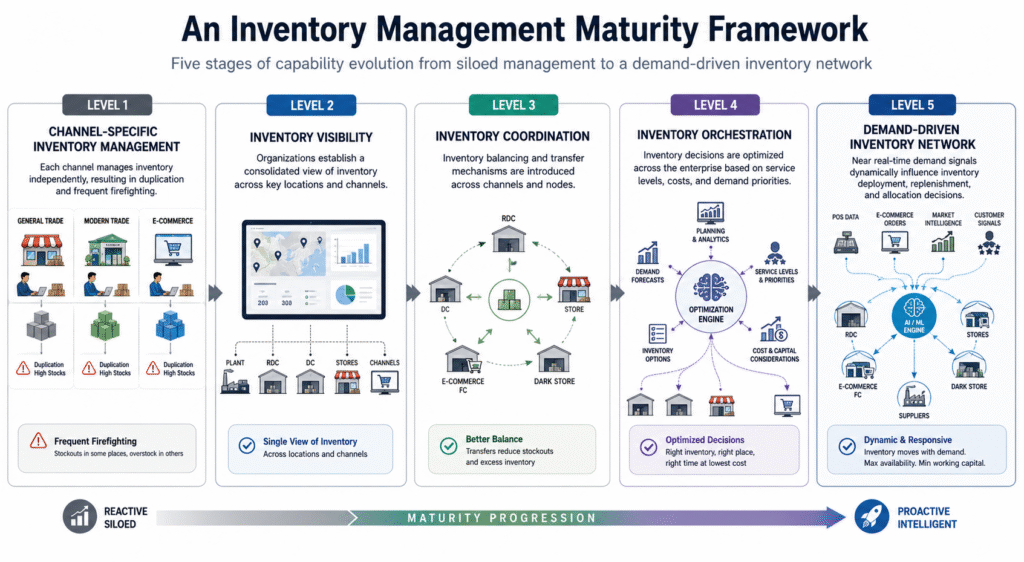
An Inventory Management Maturity Framework

An Inventory Management Maturity Framework

As organisations evolve their inventory capabilities, they typically move through five stages.

Level 1: Channel-Specific Inventory Management
Each channel manages inventory independently, resulting in duplication and frequent firefighting.

Level 2: Inventory Visibility
Organizations establish a consolidated view of inventory across key locations and channels.

Level 3: Inventory Coordination
Inventory balancing and transfer mechanisms are introduced across channels and nodes.

Level 4: Inventory Orchestration
Inventory decisions are optimized across the enterprise based on service levels, costs, and demand priorities.

Level 5: Demand-Driven Inventory Network
Near real-time demand signals dynamically influence inventory deployment, replenishment, and allocation decisions.

Few organizations have reached the highest levels of maturity, but many are beginning to recognize the need to move beyond traditional inventory planning approaches.

What We Commonly Observe

Across FMCG, food and beverages, personal care, retail, fashion, consumer durables, and aftermarket sectors, a recurring pattern emerges. Inventory growth frequently outpaces sales growth. Service challenges persist despite rising inventory investment. Different channels maintain separate inventory buffers. Visibility remains fragmented. Inventory transfer decisions are often slow and reactive. Most importantly, organizations continue attempting to solve availability problems by adding inventory rather than improving inventory deployment. This approach becomes increasingly expensive as channels proliferate.

Conclusion

The challenge facing modern supply chains is no longer inventory sufficiency. It is inventory placement. As new-age channels continue to grow, inventory will inevitably become more distributed, more fragmented, and more difficult to manage. Organizations that continue to address service challenges by simply adding inventory will find themselves carrying higher working capital with diminishing returns.

The leaders of the future will be those who can orchestrate inventory across channels, locations, ownership structures, and service requirements—delivering higher availability with lower inventory investment.

In an omni-channel world, competitive advantage comes not from holding more inventory, but from deploying inventory more intelligently.

Do you know that you are running a warehouse at home?

Do you know that you are running a warehouse at home? 1920 1080 qwixpertadmin

Indian B2C Digital business landscape

Indian B2C Digital business landscape 2560 1707 qwixpertadmin

Digital in numbers, but not the numbers corporate India is used to seeing

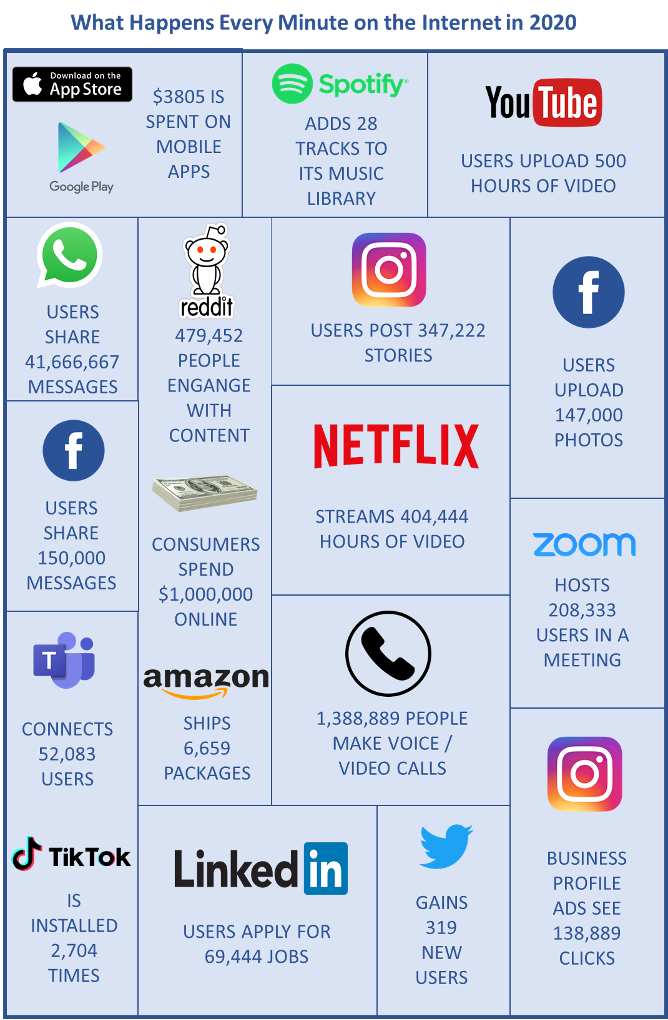
In this day and age, yesteryear business metrics such as revenue growth or profit margins, cannot adequately summarize the nascent yet vibrant digital industry. The reason why we call it nascent is that despite several decades of existence and investment, there is this overwhelming feeling of not having unearthed more than the tip of the iceberg. If you are still not convinced, just glance at the chart below.

No other industry today spawns so many innovative business models, many of which were launched from the comfort of a couch. The disruption to traditional industries due to these businesses is vast and almost immediate. Like most of you, we at Qwixpert have been repeatedly astonished by the progress made in thought and action by these businesses. “Digital” also dominates discussions in the corporate world, so much so that if a word cloud of all corporate utterances were to be created, “Digital” would probably take center place in the largest font size.

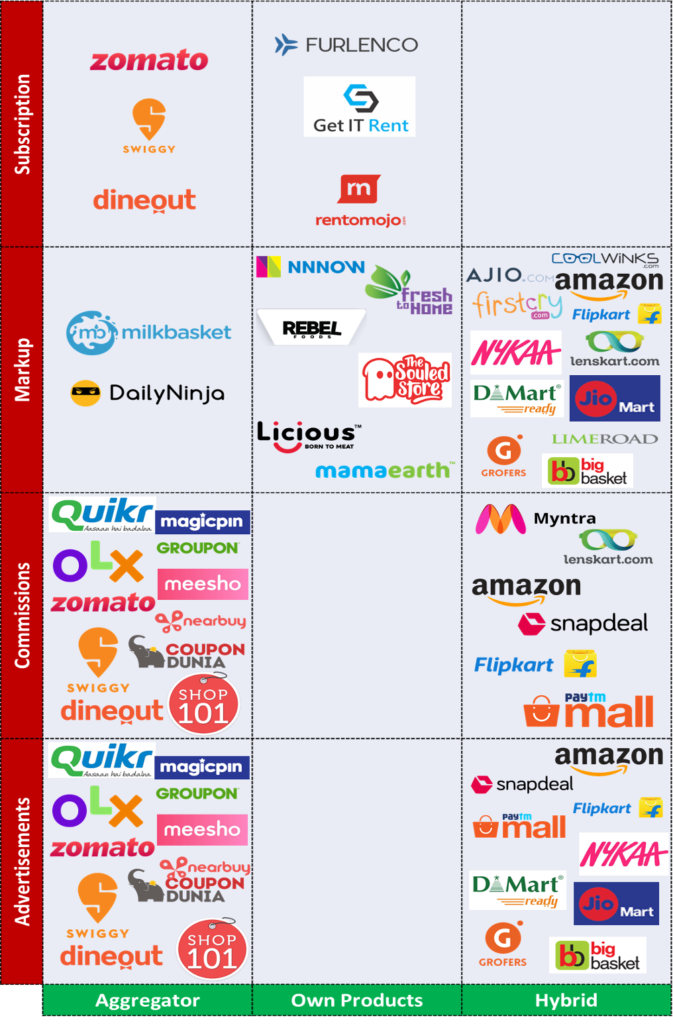
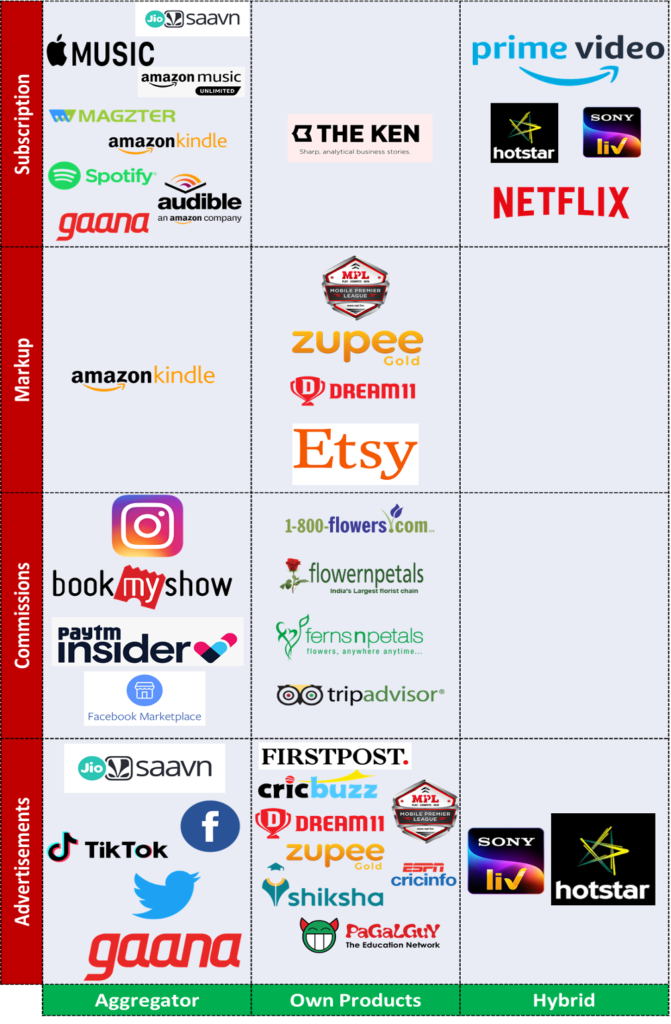
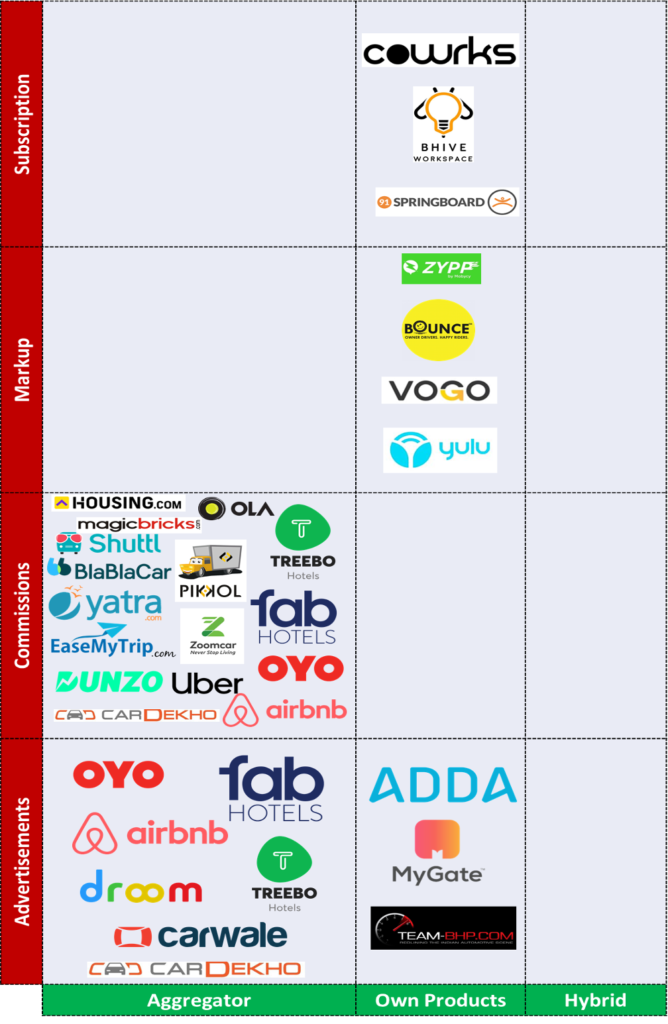
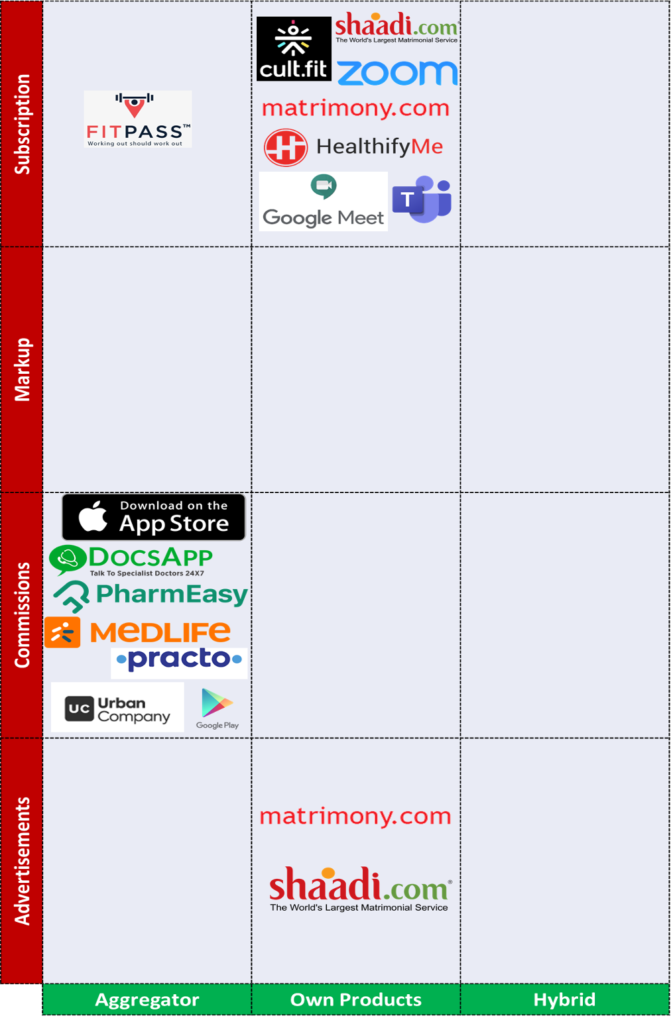
As “Digital” increasingly permeates our world, we have attempted to organize and structure it into a “Landscape.” We have limited our research to only Digital B2C businesses. The “Digital Landscape” is essentially a 2×2 matrix with “Business Model” and “Revenue Model” as its axes. These axes are defined as below

  1. Business model – What is the product/ service? How is it offered to or experienced by the consumer?
  2. Revenue model – How do they make money?

Business models can be classified into three kinds basis how consumers interact with the offerings on the digital platform

  1. Aggregator – This is the often heard of marketplace model where a platform is provided for manufacturers/ service providers to interact and transact with potential customers. E.g., “Swiggy” is an aggregator platform for restaurants.
  • Own products – The digital platform is essentially a touchpoint to interact with customers for their products or services. E.g., Byju’s is a learning platform where consumers can access Byju’s own content.
  • Hybrid – Here, the digital platform is a touchpoint for own products and hosts products from other manufacturers/ service providers. The own products offered by the platform owner may or may not differ from products listed from other suppliers. E.g., Amazon has a hybrid business model where listings are of individual brands and Amazon’s private labels.

While the fine print on business contracts will reveal subtle differences in their revenue generation models, four principal types stand-out

  1. Advertisements – Businesses pay for promotions and advertisements of their products/ brands on these platforms. E.g., Consumers are not charged for “Google searches” or “Facebook accounts,” while these companies generate the bulk of their revenues from ads and sponsored content.
  • Commissions – The platforms take a % of revenues or profits from every transaction that happens through it. E.g., Uber takes commissions on every ride booked on its app
  • Markup – The platforms purchase/ build/ manufacture products for a certain cost “X” and sell to consumers at “X-plus” through the digital platform. The key difference with the “Commissions” model is that the platform owns inventory, thereby running the risk of sitting on dead stock. E.g., BigBasket is an online food and grocery retailer which holds the inventory of the products sold on the platform
  • Subscriptions – Consumers pay a specific amount on a set frequency – Monthly, Quarterly, etc. – to access the platform. E.g., Netflix subscriptions to access their content

We have tried to “landscape” several industries into a 2X2 chart – Business Model X Revenue Model. While it is not an exhaustive list, a wide variety of companies operating in the following five industry sets are covered

  1. Retail – General Retail, Food & Grocery, Durables, Fashion, and Home décor
  2. Entertainment & Leisure – Social media, OTT, News, Gaming, Music, and Gifts
  3. Productivity – Education, Recruitment, Financial Services, Books, and Open Source
  4. Hospitality & Transportation – Automotive, Travel and Real Estate
  5. Services – Health & wellness, Household help, Matrimony, and Virtual meetings

While companies do have hybrid revenue models, a separate category has not been carved out, but both are highlighted in case multiple revenue models are present. E.g., LinkedIn generates revenues through advertisements as well as subscriptions.

Retail – General Retail, Food & Grocery, Durables, Fashion, and Home décor

Entertainment & Leisure – Social media, OTT, News, Gaming, Music, and Gifts

Productivity – Education, Recruitment, Financial Services, and Open Source

Hospitality & Transportation – Automotive, Travel and Real Estate

Services – Health & wellness, Household help, Matrimony, and Virtual meetings

Sources:

  1. https://www.visualcapitalist.com/what-happens-in-an-internet-minute-in-2019/
  2. Websites of companies highlighted

Simple ideas to improve warehouse efficiencies

Simple ideas to improve warehouse efficiencies 1536 1024 qwixpertadmin

Dear Supply Chain Head,

Given the current Covid-19 situation, I am sure you are facing a lot of uncertainties across the supply chain: workforce shortages, transport issues, government plans, demand and supply fluctuations. While there are discussions and speculations about the future, companies must undoubtedly focus on reducing cost, improve efficiencies, and manage their working capital well in the next 12 – 18 months, to emerge stronger out of this crisis.

The purpose of this series is to provide simple but effective ideas to help managers improve elements of their supply chain. In this post, I share a few ideas for enhancing warehouse performance.

It is becoming a challenge for e-commerce and consumer goods companies to fulfil orders due to the non-availability of resources in their warehouses, first and last-mile distribution. The labour shortage situation will take considerable time to improve as a lot depends on when the migrant workers can return from their native.  Also, the requirement of social distancing, if implemented well, will slow down processes and productivity levels. The onus is on the supply chain managers to not just resume warehouse operations well – with all the safety protocols but also to improve productivity levels to meet mid to long term goals of the businesses. Here are a few ideas to consider:

  • Cross Dock: Set up a cross-dock process for 20% SKUs that can deliver 50 – 60% volume – will help to move goods faster through the warehouse. The focus after the lockdown will be on top-selling SKUs – split orders in the Warehouse Management System if feasible to ease the process and improve productivity further. For large shipments, evaluate dropship directly from factories to distributors.
  • Improve Slotting: For a large warehouse with a high number of SKU’s, efficient slotting will improve productivity levels by 10 – 15%. Now is the right time to set up the process when the inventory levels are low, and locations are available to rearrange stocks.
  • Eliminate NVA’s: Map the value stream from Dock-in to Dock-out and eliminate non-value-added activities in the system, such as the unnecessary flow of goods, suboptimal picking, multiple scans, and manual processes.
  • Invest in Automation: Automate highly repetitive activities and manual efforts that do not add value to the processes. Semi-automated pack stations, auto-assigning tasks to operators by WMS based on a pre-defined algorithm, transport conveyors, put-to-light sorting/ order consolidation are some examples. If your order and volume complexities are high, evaluate investing in a highly automated warehouse.
  • Invest in training: This may sound counter-intuitive – why would I use the time to train instead of using the time for production? By training, I refer to building flexibility in the system. In a large warehouse, there are 40 – 50 different activities and managers should have the flexibility to move resources from one function to the other, depending on the workload. While training might take 2-3 weeks for existing staff, but the overall capability of the warehouse goes up. Use overtime and extra hours for training.
  • Communicate: Having run warehouses, I know it is important to communicate not just at an organisation level but also at an individual level. Make your front-line leaders accountable to have frequent and consistent touch points at all levels. Listen actively, get feedback from your staff, and solve their problems. Done well, not only will it improve employee morale and retain talent but also increase workforce productivity.

Depending on your industry and warehouse operations there could be more ideas ,but 20 – 25 % improvement in productivity is achievable. The key is to identify opportunities, spend time on planning now, and start implementing soon after operations resume.

I look forward to hearing your views on the above ideas and some more ideas if you would like to add.

In the next post, I will discuss the challenges and potential improvement opportunities in the logistics and transportation side of the supply chain.

– Rajan Ekambaram, Partner, Supply Chain Practice Qwixpert