A common complaint among FMCG supply chain leaders today sounds something like this:
“Our inventory is higher than ever, warehouse space is under pressure, and yet we continue to face stock-outs on key digital channels.”
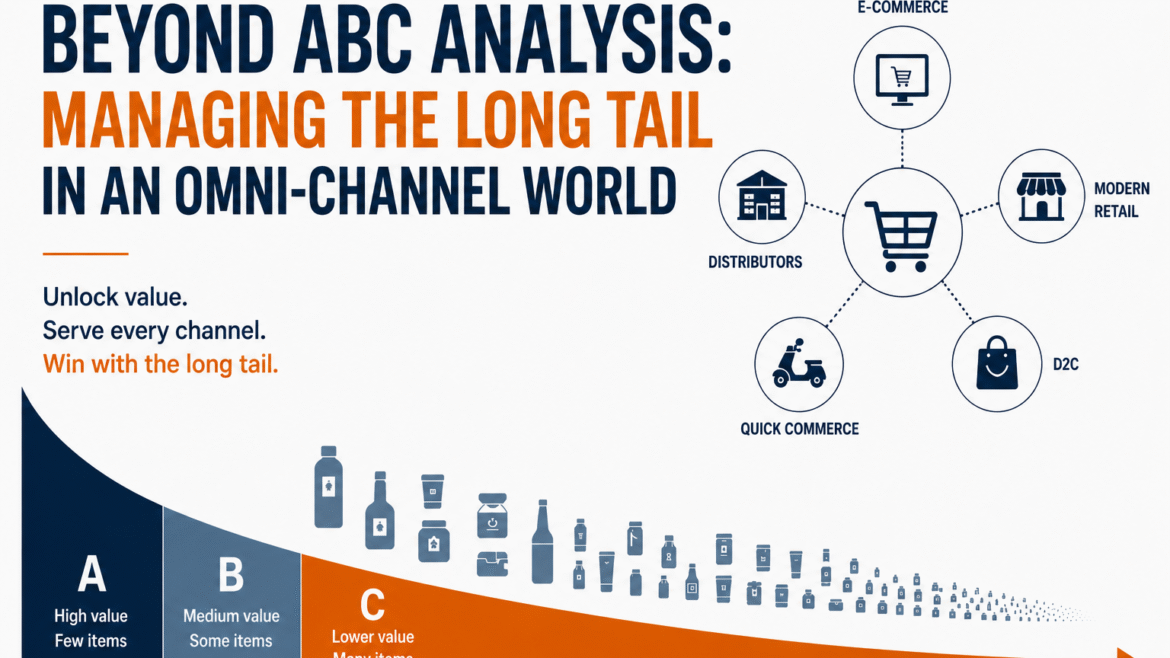
At first glance, these issues appear unrelated. However, in many organisations, they stem from the same underlying challenge: the growing long tail of SKUs created by e-commerce marketplaces, quick commerce, and Direct-to-Consumer (DTC) channels.
For decades, FMCG supply chains were built around a relatively concentrated product portfolio. General Trade (GT) and Modern Trade (MT) naturally filtered assortments. Shelf space was limited, distributors focused on fast-moving products, and planning teams could concentrate on a manageable set of high-volume SKUs.
The emergence of digital channels has changed that equation. Every flavour, pack size, variant, bundle, gift pack, regional assortment, and limited-edition product can now be listed online. Consumers expect choice, and digital platforms reward breadth of assortment. As a result, SKU counts have grown significantly across many FMCG categories.
The challenge is that while the revenue opportunity from the long tail is real, managing these SKUs using traditional planning and inventory policies can create substantial operational and financial inefficiencies.
The Problem is Not the Long Tail
Many organisations respond to growing SKU complexity by launching SKU rationalisation exercises. While rationalisation has its place, it is often an incomplete solution.
Not every low-volume SKU is a bad SKU. Some products play an important role in attracting consumers to digital platforms. Others serve niche but profitable customer segments. Certain SKUs support premium positioning, seasonal campaigns, or new product launches. Eliminating them purely because they have lower volumes may hurt growth more than it helps efficiency.
The real problem is not the existence of long-tail SKUs. The problem is managing them using the same planning, sourcing, inventory, and service policies as fast movers. In other words, the future of long-tail management is not aggressive SKU reduction. It is differentiated management.
Why Traditional ABC Analysis is No Longer Enough
Most supply chains still rely heavily on ABC analysis: Fast movers become A-items, Medium movers become B-items, and Slow movers become C-items.
While useful, this approach was designed for a simpler world. Today’s omni-channel environment requires a richer understanding of SKU behaviour. A slow-moving SKU can still be strategically important. A seasonal product may have low annual volume but extremely high demand concentration during specific periods. A marketplace-exclusive pack may contribute little revenue but help improve search visibility and consumer acquisition. Treating all slow-moving products the same often leads to poor decisions.
Traditional ABC analysis answers only one question: How much does a SKU sell? Unfortunately, modern supply chains need to answer several additional questions. Is demand predictable? Is the SKU strategically important? Does it carry high obsolescence risk? Does it move frequently enough to justify frequent replenishment? These questions require a broader classification framework than sales volume alone.
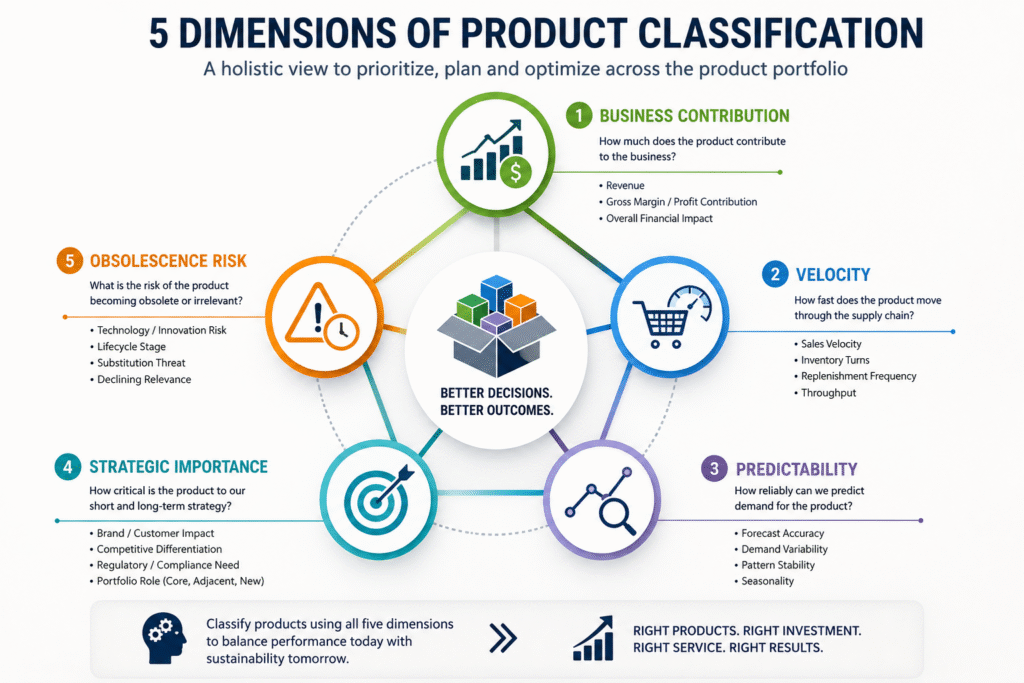
A More Practical Framework for Long-Tail Management
Instead of classifying products solely by volume, organisations should evaluate SKUs across five dimensions.
1. Business Contribution
How much does the SKU contribute to the revenue? This is a traditional ABC Pareto analysis, with A, B, and C category SKUs contributing 80%, 15%, and 5% of revenue, respectively. This classification helps the planner identify the SKUs that drive sales. The exact cut-off could be modified to 60-30-10 or 70-20-10 depending on the business. In some of the businesses, profit contribution is considered instead of revenue.
2. Velocity
How quickly does the SKU move? Velocity is usually measured using the frequency of the orders. Another term the industry uses is “runner,” “repeater,” or “stranger.” This remains important because velocity directly influences inventory turns, replenishment frequency, and warehouse handling requirements.
3. Predictability
How stable is demand? This is measured by the uniformity of the orders throughout the year. Some products exhibit consistent demand patterns while others are highly seasonal, promotion-driven, or event-driven. SKUs could be classified as regular, irregular, seasonal, or sporadic. Similarly, if the SKU is forecastable or non-forecastable. Two SKUs with identical annual volumes may require completely different inventory policies if their demand profiles differ.
4. Strategic Importance
What role does the SKU play in the portfolio? Certain products may be critical despite low sales volumes. Examples include premium variants, marketplace exclusives, hero products, or strategic new launches. Revenue contribution alone does not determine business importance. Often, there are flagship products that define the company’s competitive position. Sometimes, the product needs to be planned as part of portfolio completion.
5. Obsolescence Risk
How likely is inventory to become unsellable? This is particularly relevant in FMCG categories with shelf-life constraints. Low-velocity products with short shelf life require very different planning policies than low-velocity products with long shelf life.
These five dimensions create a more meaningful basis for segmentation and decision-making than traditional ABC analysis alone.
The Hidden Cost of Long-Tail SKUs
One of the most common mistakes organisations make is focusing exclusively on procurement economics.
Procurement teams often seek larger purchase quantities to improve unit costs, secure volume discounts, or optimise freight economics. While this may reduce purchase costs, it can significantly increase inventory carrying costs, obsolescence risk, warehouse complexity, and working capital requirements.
In many situations, the cheapest procurement decision becomes the most expensive inventory decision. In many situations, the cheapest procurement decision becomes the most expensive inventory decision.
Purchasing six or twelve months of inventory may appear attractive from a sourcing perspective. However, the resulting inventory exposure can lead to write-offs, liquidation discounts, excess warehouse occupancy, and capital locked in stock that may never be sold.
Every additional long-tail SKU also consumes planning bandwidth through forecasting, exception management, parameter maintenance and master data administration.
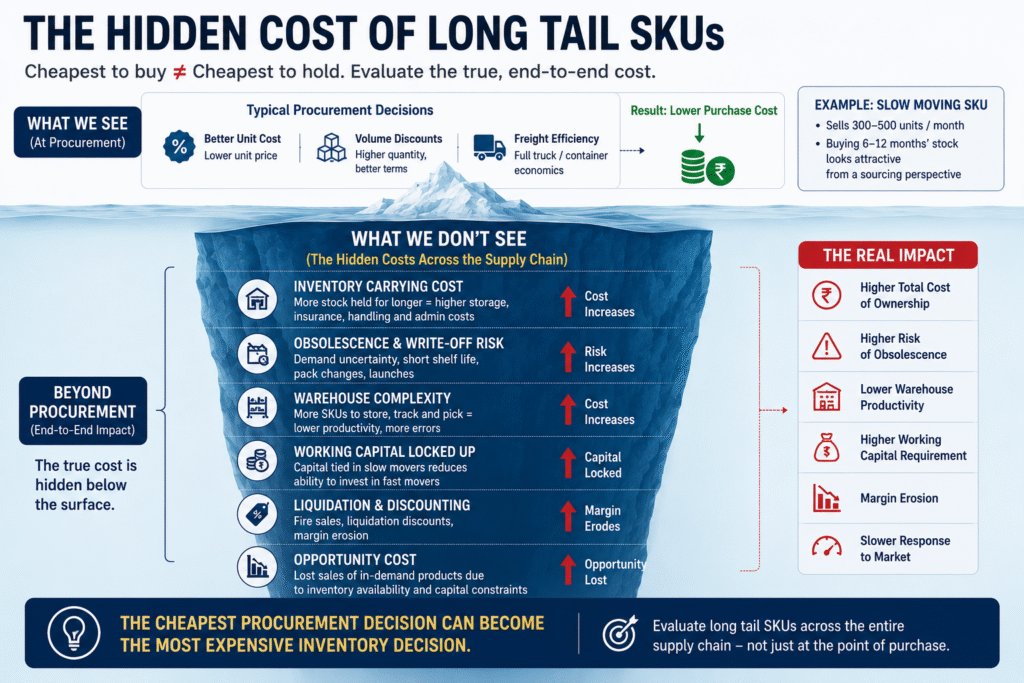
The economics of long-tail products must therefore be evaluated across the entire supply chain rather than within procurement alone.
Different SKUs Require Different Service Levels
Another common practice is applying similar service targets across the portfolio. Many organisations target 95% availability for virtually all products. While appropriate for core fast-moving products, this approach often creates unnecessary inventory investment for long-tail items.
Service levels should not be determined by sales volume alone. They should reflect the product’s business contribution, lifecycle stage, strategic importance and channel role.
A more effective approach is differentiated service management. Core products may warrant service levels above 90-95%. Growth products may require 95–98%. Strategic niche products may operate at slightly lower levels. Low-priority long-tail products may justify even more selective inventory policies. The product on exit will not even have service level targets and probably will have as low as 30-50% service levels. The objective is not to reduce service indiscriminately. It is to align service expectations with business value.
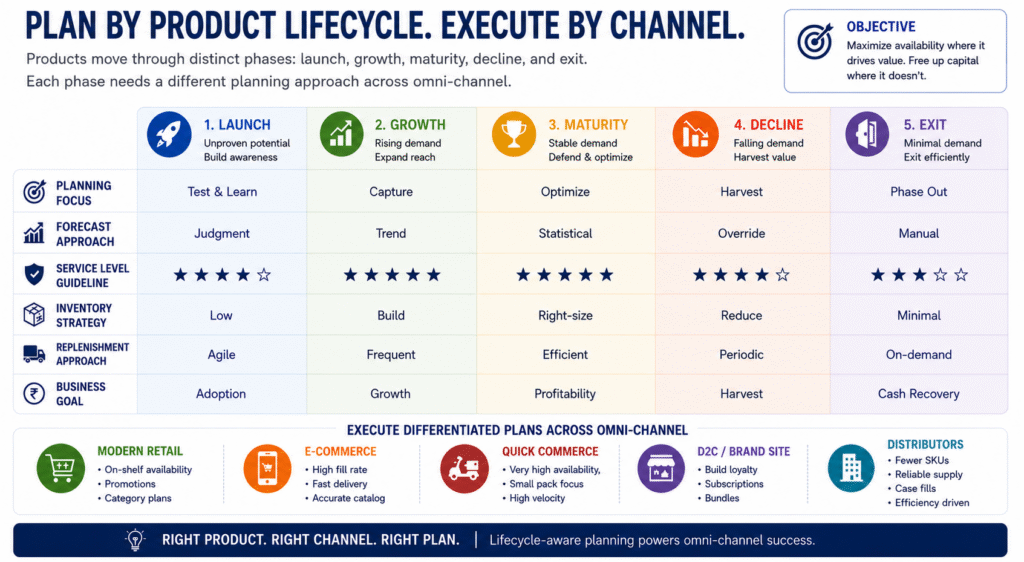
Lifecycle Management Matters
Perhaps the most overlooked aspect of long-tail management is lifecycle tracking. Products move through distinct phases: launch, growth, maturity, decline, and exit. Yet many organizations continue using the same planning parameters throughout the product’s life.
As products mature and demand patterns change, inventory policies, service levels, replenishment frequencies, and sourcing strategies should evolve accordingly. Lifecycle-driven planning helps organizations reduce obsolescence risk while maintaining availability where it matters most.
Lifecycle transitions should automatically trigger changes in planning parameters rather than relying on manual planner intervention.
What We Commonly Observe
Across consumer goods, food and beverage, personal care, retail, fashion, and consumer durables sectors, a recurring pattern emerges. Although the exact numbers vary, we frequently observe that roughly 20–25% of SKUs generate most of the revenue, while the remaining long tail drives a disproportionate share of inventory, planning effort and warehouse complexity.
However, the answer is rarely wholesale rationalisation. Organisations that achieve the best results are those that develop differentiated policies for different SKU segments balancing availability, working capital, service, and profitability according to the characteristics of each product.
Conclusion
The growth of e-commerce, quick commerce, and DTC channels has made the long tail a permanent feature of the modern FMCG landscape. Consumers expect choice, and digital platforms reward breadth of assortment. The question is no longer whether organisations should carry long-tail SKUs. The question is how intelligently they manage them.
The future belongs to companies that move beyond traditional ABC analysis and adopt differentiated approaches to inventory, sourcing, service levels, and lifecycle management. Competitive advantage in an omni-channel world will not come from carrying fewer SKUs. It will come from understanding which SKUs deserve different supply chain policies—and having the discipline to execute them consistently.
About the Authors
Qwixpert is a boutique management consulting firm focused on building Future-Fit Supply Chains. The firm works with organisations across consumer goods, retail, fashion, industrial products, and aftermarket sectors to improve agility, inventory productivity, fulfilment performance, and supply chain decision-making.
Through more than 100 consulting engagements across 16 industries, the team has observed how digital channels, changing consumer behaviour, and rising service expectations are redefining the role of supply chains.
This article is part of a broader series exploring the implications of these shifts in trade channels and the capabilities organisations need to build for the future.