Business Strategy

Rising Spirits: The Surging Popularity of Indian Single Malt Whisky

Rising Spirits: The Surging Popularity of Indian Single Malt Whisky 2560 1706 qwixpertadmin

Executive Summary:  

This article talks about the ballooning demand for Indian Single Malts India & global markets. Growing demand has come on the back of fruiter, less smoky taste & favourable price compared to other whiskeys. The growing demand has led to new product launches & capacity expansion. Indian Whiskey makers can leverage the tailwinds through product innovation & image makeover of whiskeys in India to target millennials similar to how Japanese & Chinese whiskey makers have popularized their whiskeys. 

Single Malt is a niche segment that is rapidly expanding at 18% YoY growth due to the trend of premiumisation 

The Indian Luxury whiskey market is a niche market with sales of 5.3 Mn cases in 2021. It has grown 6% YoY (volume) compared to the degrowth of -1% in the overall whiskey market during the same period. The growth can be attributed to premiumization of the consumption ecosystem.  

The Luxury whiskey market is dominated by blended whiskeys – 96% share and an emerging Single Malt market with 4% share (Figure 1). Despite being a niche, Single Malt market has gained notable prominence in the past six years, outgrowing any other whiskey segment with a healthy 18% YoY growth. As a result, it has doubled its market share in luxury segment from 2% in 2015 to ~4% in 2021 

Figure 1: Luxury whiskey market growth and components 

Single Malts originated in Scotland around 15th century, but its sales were limited to the United Kingdom. In the last century, Single Malts gained global recognition as a premium whiskey, motivating whiskey producers in countries such as United States of America, Australia, Japan, and Taiwan to make their own version of Single Malts. Following the trend, the Indian company Amrut distilleries launched the first Indian Single Malt in 2003. Since then, Indian Single Malts have become popular with more manufacturers investing in the segment.  

We believe that there is a profitable long-term game in the Indian Single Malt market and in this article, we examine the distinctive features of the product that have led to market creation and recommend potential strategies for top-line growth.  

Indian Single Malts are growing at 37% YoY backed by their unique flavour profile, economical pricing, and captive sales channel 

The Single Malt market in India is currently dominated by Imported Scotch Single Malts with 65% market share and Indian Single Malts at 35% market share. Although Indian Single Malts is more nascent, it’s been growing 37% YoY over the last 6 years, compared to 13% growth rate for Imported single malts. The share of share of Indian single malts has increased from 15% in FY15 to 36% in FY21 (Figure2).  

Figure 2: Market share of Indian and Imported Single Malts in India 

The key brands in Single Malt in India are: French liquor manufacturer Pernod Ricard’s Glenlivet with ~24% market share, Indian player John Distilleries’ Paul John with 21% market share and Glenfiddich from Scottish distiller William Grant and Sons with 14% market share. Others includes Scotch Single Malts such as Macallan by the Macallan distillery, Singleton by Diageo and Indian Single Malts such as Amrut by the Amrut Distilleries and Rampur by Radico Khaitan (Figure 3).  

Figure 3: Key Players in Indian Single Malt market 

The tremendous growth for Indian Single Malts in the domestic market can be attributed to its distinct taste profile, economical pricing, and captive sales channels. The distinction in taste arises from the differences in the raw material, production processes and climatic conditions between India and Scotland (Figure 4) 

Figure 4: USP of Indian Single Malt 

These India-specific features cumulatively give Indian Single Malts a fruiter and non-smoky flavour with mellow taste notes as compared to smoky scotch single malts which are generally heavier on the palate. According to Hemant Rao, Founder of Single Malts Amateur Club (SMAC), these features ensure that Indian Single malts are easier on the palate for young drinkers and suits the taste preferences of Indian consumers. Further, the 3x faster ageing ensures that the inventory turnaround is relatively faster, and companies can react to emerging market trends more quickly. 

Aiding the growth of Indian Single Malts, the 150% Import duty on Imported Malts creates a considerable price difference between Indian and Imported Single Malts where Indian Single Malts are available at ~60% of the price of Imported Single Malts across India (Figure 5).  

Figure 5: Price comparison between Indian and Imported Single Malts 

The price differential has translated into increase in sale for Indian Single Malt manufacturers. Paul John, which introduced entry level Indian Single Malts in the market and is credited for democratizing the market, holds a 60% market share in Indian Single Malts market in India and is the only Indian Single Malt brand in top three Single Malt brands sold in the country. 

Indian Single Malt industry has received support from Government as well, the ban of foreign liquor in 4000+ army canteens across the country has created a captive market for Indian Single Malts. It is projected to replace the Rs.  140 Cr. worth of sales imported alcohol clocked in FY2020 from army canteens.  

All these factors together have cumulated in creating an unexpected surge in demand for Indian Single Malts resulting in supply shortage. Pioneers such as Amrut, Paul John or Rampur have been facing shortages or stock-outs in the domestic market. For instance, Amrut sold out its annual inventory of 33,000 cases in the first five months of FY22. Similarly, sales of Rampur Single Malt are constrained to Delhi-NCR region and select five-star properties due to supply shortages. Mr. Sanjeev Banga, president of international business at Radico Khaitan expects the shortage to persist till FY24. 

Demand for Indian Single Malt have outpaced the supply and Industry is reacting by investing in capacity expansion and product launch

To counter the supply shortages, strategic planning and capacity expansion spanning over long-term horizon will be crucial due to the bottleneck caused by long production and aging process. In line with this, the major players have already started investing in production and storage capacity (Figure 6) 

Figure 6: Capacity Expasion by Indian Single Malt Manufacturers

The extremely attractive domestic demand prospect has led to new product launches by global alco-bev manufacturers and non-legacy players. Diageo which has a portfolio of popular Scotch Single Malts such as Talisker and Singleton, launched their first Indian Single Malt named Godawan with the expectations that Indian Single Malt Market will overtake Imported Single Malts in upcoming years.  

Distilleries such as Piccadilly and DeVANS Modern Breweries, which traditionally produced and sold malt spirits and distilled ENA to whiskey manufacturers, have launched Indian Single Malts under their own brand name i.e. Indri Trini and Gianchand respectively. The brands have been well-received and have gotten accolades from across the globe. Recently, Jagatjit Industries, makers of popular aristocrat whiskey have also announced their plans to enter Single Malt whiskey market in India. 

The recent investments in capacity and entry of new players indicates that by 2026-27, the annual supply of Indian Single Malt would reach around 600,000 to 700,000 thousand cases, which is around 9-10 times the current demand for Indian Single Malts. To match the supply planned for Indian Single Malts by the manufacturers over the next 5 years, the market demand would have to grow 54% YoY against the 37% growth it has clocked over the last 5 years. To cater to the growth momentum, we believe the organic demand growth should be aided by investment in market development  

Whiskeys need an image makeover to appeal to a larger target segment, Indian Single Malts can learn from global counterparts –  

For market development, we believe that adopting best practises from emerging whiskey markets like China, Japan and Taiwan can be insightful as they also went through a rapid growth phase (as indicated in Figure 5).  

Figure 7: Growth of Single Malts Whiskeys in emerging markets 

While Scotch whiskeys have a strong taste and incline towards smoky flavour; Japanese whiskeys are known for a softer taste with floral and fragrant notes. Japanese Whiskey makers also offer a variety of flavours – for instance, manufacturer Yamazaki can produce up to seventy styles of malt whisky in house, using seven different types of stills, five types of casks, and two types of fermentation. Similarly, the top selling Taiwanese whiskey called Kavalan Classic has a mellow flavour than a typical single malts and is often compared to fruit jam. As mentioned by Lee Yu-Ting, CEO of Kavalan’s umbrella company, the company doesn’t want the whiskey to taste like medicine.  

There are four major factors leveraged by global single malt manufacturers – product differentiation in terms of taste profiles, shifting target segment to young population and women, liberalising the image around single malts and increasing awareness through engagement marketing.  

The distinct and sweeter taste profile of these whiskeys is loved by the whiskey drinkers all over the world, including India – evident by the growth of export for these whiskeys (indicated by figure 6). Japanese whiskeys makers like Beam Suntory have launched the premium portfolio in 2019 for top tier Hotel chains, premium bars and restaurants in India and have already sold more than three lakh cases of Japanese whiskeys since then. There is a strong play for the inherently fruiter Indian single malts to develop a wider range of flavours that can gain a strong foothold in the Indian market. 

Figure 8: Growth of Japanese and Taiwanese whiskey exports 

Growth of disposable income in the millennials and change in the perception of whiskey that it’s a men’s drink has led to the growth of non-traditional consumer segments in emerging markets. For instance, in China the imports for scotch single malts by 20x in the last decade due to growing demand from young customers and increased per capita consumption from women drinkers (1.6 Ltrs in 2005 vs 3 Ltrs in 2028). Similarly, Indian Single Malt manufacturers can redefine the target segments to include the burgeoning segment of young customers. By leverage on the social drinking and experimental tendencies of the youth, they can introduce consumers to whiskey early in their lifecycle and attract a larger customer base of millennials and women. 

To appeal to the new-age consumer segment, Japanese whiskey makers have liberalised the stiff image associated Single Malts by promoting single malts as craft cocktail. In 2008, Suntory, the biggest Whiskey producer in Japan, ran an advertising campaign to promote the consumption of highballs – a cocktail that can be made with blended or single malt whiskey and soda. This introduced Single Malts as a fun casual drink for the younger generation, as opposed to being an older “salarymen’s” drink. The Highball campaign proved to be highly successful, increasing the sales of base whiskey by 70% in the following year. Similarly single malts have been used to elevate the depth and flavour of cocktails such as Hot Toddy, Penicillin or whiskey and coke.  

Engagement marketing activities such as tasting seminars, stalls at whiskey exhibitions, partnering with whiskey fan clubs and developing whiskey bars has been a successful marketing strategy for Global Single Malt players. For instance – Taiwanese whiskey maker Kavalan opened branded whiskey bars and liquor stores in China to promote their whiskeys. Even global players such as Diageo and Glenfiddich have partnered with millennial YouTubers to educate young customers about single malts whiskeys and the preconceptions around it.  

Indian Single Malts are well positioned to follow suite the global trends due to the distinct fruity flavour, emerging theme of premiumisation and a favourable demographic of millennials. Hence, by doubling down on the advantages of Indian Single Malts, coupled with experiential marketing tactics can go a long way in exploring the exciting opportunities this nascent yet vibrant segment has for offer.  

Conclusion 

Due to an inherently unique product and driven by strong market factors like economical pricing, captive canteen markets and favourable demand conditions, the Indian Single Malt market has been growing at tremendous pace. As shortages and stock-outs of Indian Single malts prevail in the market due to unexpected demand surge, manufactures have resorted to capacity expansion projects and additional investments by new players (domestic and foreign). We believe that investment in market is also important to continue this growth momentum look towards the emerging markets like Taiwan and Japan for best practises. Indian Single malt manufactures should experiment with new flavours that can appeal to a larger target segment consisting of women and younger demography; cocktails using Indian Single Malts can help position the beverage as a casual party drink and experience marketing using tasting clubs or exclusive whiskey bars to reach the target segment. We strongly believe that exploring the potential of the segment and committing a long-term play can yield favourable results. 

Authors: Jitendra Maheshwari and Vasupradha Sridharan

How would FMCG distribution of the future look like?

How would FMCG distribution of the future look like? 781 527 qwixpertadmin

Executive Summary

Emerging Tech based B2B models are disrupting the traditional distribution space. Unlike the traditional distribution model which has only one source of revenue i.e., via trade of products, the new age tech-driven businesses can generate income from advertisements, data analytics, private label sales, financial and PoS services. These allow online platforms to pass higher product margins to retailers. FMCG Distributors must offer additional value and create differentiated offerings to retailers to level the playing field. Consolidation in distributor territories will be actively pursued by FMCG brands. Multi-brand master distributors akin to those in consumer electronics and global auto sales are expected to emerge. Partnerships with financial institutions, PoS solutions providers and distributed warehousing for faster replenishment. Additionally private labels and backward integration into 3PL and warehousing services can add to distributors ability to compete.

Emerging Business models in B2B Distribution landscape

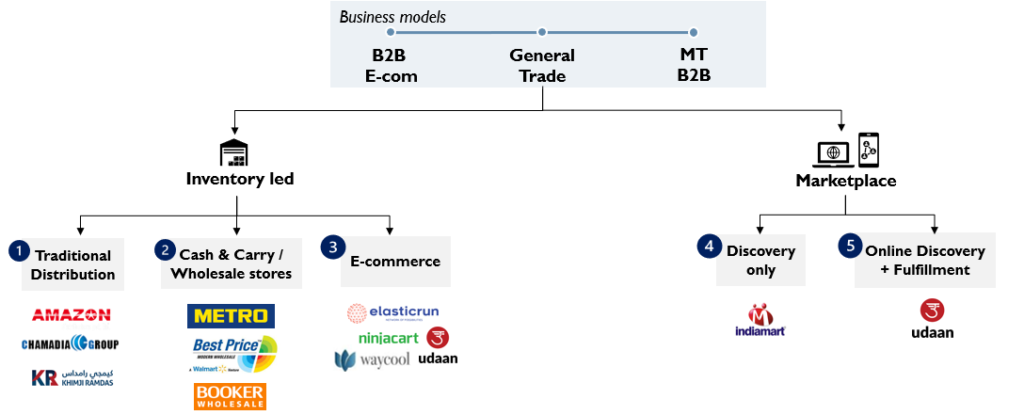
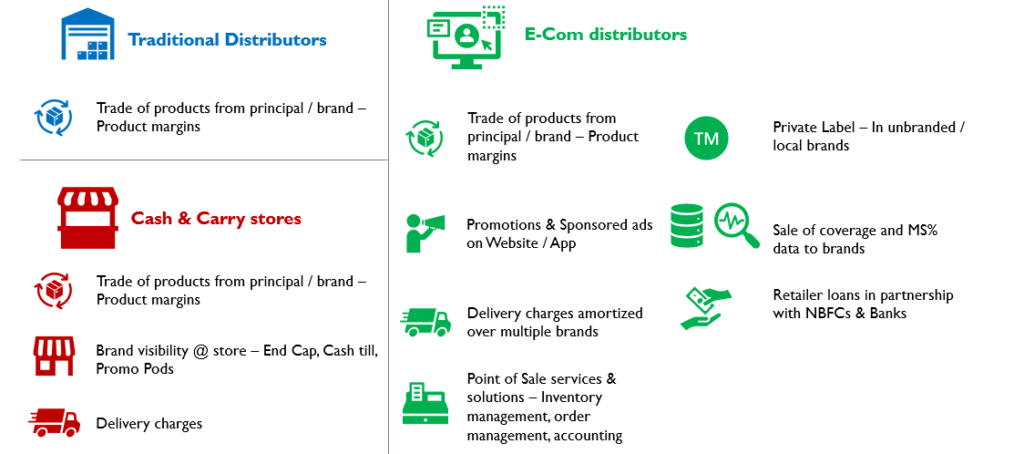
Initially FMCG downstream supply chain had a “distributed” channel structure. Traditional distributors covered towns or part of towns and were mostly exclusive to a particular brand, built relationships with the many thousand general trade outlets and wholesalers operating locally. Retailers in a town depended on these distributors to deliver orders or visited wholesalers to pick up required stock. This traditional distributor managed demand and working capital efficiently doling out micro-credit and also drove trade marketing initiatives for the brands. This model was first disrupted by the brand aggregators – Modern Trade Wholesalers like Metro, Booker and Walmart. These MT outlets offered a one stop-shop for retailers across brands and categories, but did not offer door-step delivery unlike the traditional distributors. The informal credit practice was also not extended. Prohibitive freight costs in low volume towns meant direct coverage was ~50 – 60% for even the biggest of FMCG brands. Online platform led distribution wishes to offer the best of both worlds – aggregated demand to be a one-stop shop for the retailer, amortizing freight costs to ensure direct distribution with door-step delivery and offer micro-credit with partnerships.

Fig 1: Comparison of different business models in FMCG B2B distribution

The traditional distributor and the cash & carry wholesaler-built businesses on an inventory led model, where stock is purchased from FMCG brands to be resold. Working capital management becomes critical with low profit margins and large revenues. Success depended on the business owner’s ability to rotate capital as many times as possible. Marketplace platforms, avoiding taking inventory onto their books by creating a platform for buyers & sellers to engage directly. They may or may not undertake order fulfilment creating two business models – Discovery only and Discovery and fulfilment.

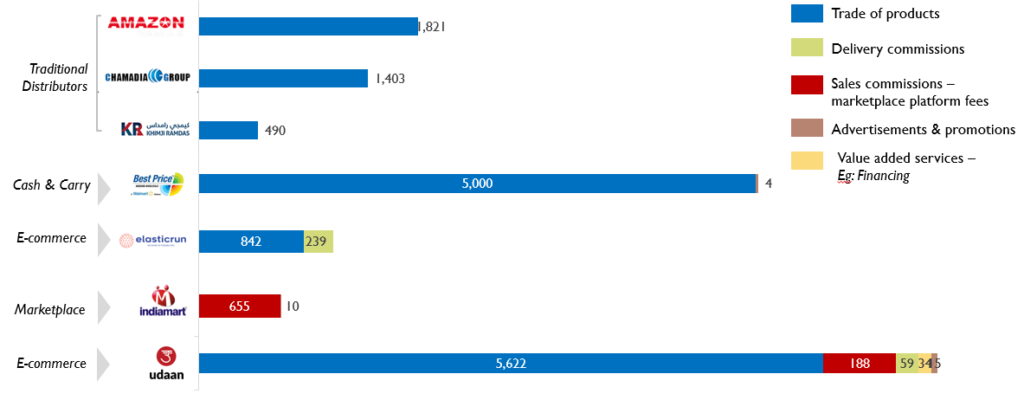
Each of these Business models have different sources of revenue

Analysis of each business highlights the various revenue models in play. A traditional distributor generates revenues on the wholesale trade of products and manages all costs of operations within the margins offered by the principal brand(s). Cash & carry stores can additionally generate promotional income from brand visibility – on shelves, cash tills, end-caps and in-store promoters. In the recent past, cash & carry wholesalers have built websites and mobile applications to allow retailers the convenience to order online and get deliveries for an extra charge.

Fig 2: Comparison of operating revenue streams in FMCG B2B distribution – FY21

E-Commerce platforms using the inventory or the marketplace model generate promotional income from brands through brand pages, search based advertisements and sponsored listings. Organizations like Udaan, Elastic Run are additionally offering micro-credit to fund for the retailers’ working capital.

Profitability built on lean and efficient operations in inventory models 

Fig 3: Comparison of operating revenues, costs and margins across business models – FY21

The traditional distribution system operates on a gross margin of ~8 – 12%, for mass market products. These wafer thin margins, drive the distributor ecosystems to have lean and efficient operations. Low inventory levels with “Fast moving” stock characterises the inventory model and hence offers the name to the industry – “Fast Moving Consumer Goods”. Manpower productivity and optimized freight costs are critical to profitability and so is effective credit cycle and cash flow management. Companies operate with 15 – 20 days of stock and ~20 – 30 days of payable and receivable days. This working capital is usually the investment made by the distributor and if these benchmarks are maintained, the distributor can expect an RoCE of ~30%. Qwixpert’s analysis indicates the median RoCE of the top distributors of the country is ~33% and they operate at 21 days of inventory, 20 days of sales outstanding and 15 days of payables outstanding.

The contrasts can be noted in Indiamart’s marketplace model, where the gross margins are at ~90%. The marketplace platform charges fees on the discovery and engagement between buyers and sellers, while IT & employee costs borne to manage engagement & discovery are the primary cost of services.

Assessment of cost drivers indicate the need for lean business operations to drive profitability

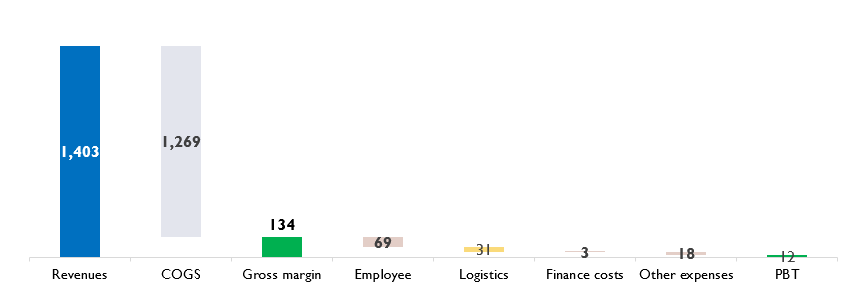
The traditional distributor is not too worried about revenues. The margin and the “fast moving” nature of the merchandise are more critical factors in deciding the SKUs to stock and volumes to purchase. Higher the premiumness of the merchandise, higher the gross margins. To drive profitability, the distributor from hereon, effectively utilizes assets – warehousing infrastructure, logistics network, inventories, sales & distribution manpower. Four key metrics – SKU throughput, freight cost per unit, manpower productivity and inventory days – are measured and optimized for religiously. An analysis of one of P&G’s largest distributors – Chamadia Group (Fig 4) – indicates how razor thin profit margins look when compared with product revenues. But, a comparison with the gross margins indicates a reasonable 9% profitability before tax.

Fig 4: Chamadia Group – Profitability waterfall – FY21

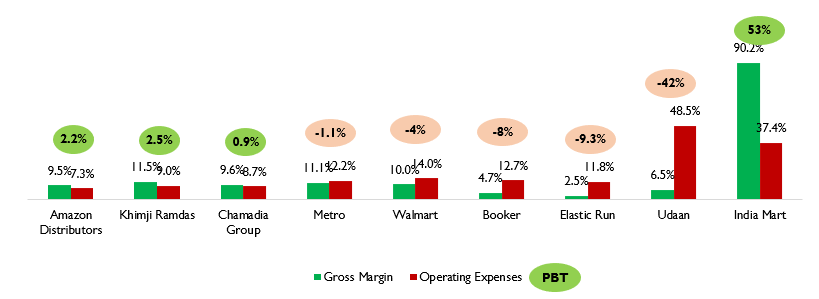
The modern trade wholesalers are yet to make profits and the likes of Walmart benefit at a group level from the Indian office, by sourcing private label manufacturers for their global businesses. Negative bottom lines are also a reflection of the operating costs not being lean, as seen in Fig 5 – This can be noticed from the similar gross margins to traditional distributors but much higher operating costs. The online distributors – Elastic Run, Udaan – have much thinner gross margins, indicating their aggressive pricing to capture the market. Udaan’s overheads are significantly higher and need to be drastically optimized or monetized for profitability. Elastic Run’s operating costs are in line with traditional businesses, indicating a much tighter business.

Fig 5: Profit margins as a % of revenue – B2B distribution businesses – FY21

There are primarily 2 ways by which firms can increase their profitability in B2B distribution landscape i.e., Optimizing the cost-to-serve or by increasing the product margins.

In the Traditional Distribution business, cost-to-serve is optimized by enhanced productivity of manpower and/or investing in supply chain automation – warehousing to achieve a trade off between throughput, storage density and labour expenses & logistics – inhouse vs 3PL, route & fleet optimizations. Increasing the mix and throughput of premium merchandise (higher margin products) in sales can increase profitability. Upgrading the customers to higher margin products is a function of consumer economic growth and brand marketing. The E-commerce distribution model, on the contrary, offers new income streams compensating for the higher margin passed on to the retailer.

E-Commerce businesses bet on new revenue streams to overcome higher costs

Traditional distributors begin to extend their businesses into the premium range, with non-competing brands or in non-competing geographies to increase bottom-lines. Chamadia Group, for instance, has a separate business focused on distribution of imported & premium products. Higher margins are also present in selling unbranded and locally manufactured products – Eg: Grains, pulses, local snacks and by venturing into Private labels. Existing retail coverage and the understanding of the General Trade market are key USPs which traditional distributors can leverage to succeed in private label businesses.

The Cash & carry players offer Product placement / positioning within their stores i.e., Endcap and Cashtill display to give brands a competitive advantage. It is often available for lease to the brands at a cost. Organizations like Walmart bet big on Private labels a ~25 – 30% of their global business is generated from Private Labels.

Additional revenue can also be generated by offering various Value-added services in both online and offline distribution models. Within the online model revenue can be generated from the Brand promotions on the websites / apps, engaging in targeted advertisements directed at an audience with a particular trade pattern or purchasing behaviour. Search Engine Optimization (SEO) services to Brands i.e., charging the brands for listing their products in the top of the search results, are opportunities similar to E-Commerce B2C models.

Value Added services such as extending a line of credit to retailers through tie-ups with Banks to ensure working capital availability to shop owners and sale of Market data to FMCG companies to help them better understand the retail landscape, their market share, penetration, and demand preferences, are potential revenue opportunities in the e-commerce businesses.

Fig 6: Revenue streams for various distribution models

The traditional distribution finds itself at a disadvantage trying to compete against an more equipped business model. However, the merits of an on-ground relationship between the brand and the retailer through a distributor cannot be overstated. More so in India, where the informal sector’s success cannot be explained only through numbers. Brands are also cognizant of their long partnerships with these distributors and evaluating options to move forward. It is Qwixpert’s belief that the traditional distribution model is still relevant but will undergo changes to remain competitive in the long run.

By 2030, the traditional distributors will consolidate, differentiate with localized products and also offer value added services through partnerships

With the digital disruption in the B2B distribution space, retailers have new wholesalers & distributors to purchase from. This also opens retailers’ option to new product offerings under existing as well as new categories and additional products – Eg: financial services on one platform. Point of Sale services such as invoicing, accounting and replenishment can be integrated which makes order placement, fulfilment and GST filing simple and fast for retailers.

Traditional distributors are expected to consolidate to become multi-brand and multi-category distributors. Global multi-brand distribution operating models as seen in Electronics (Eg: Ingram, Redington), Automotive (Eg: Autonation, Penske) are soon to be replicated to compete successfully against online platforms. Traditional distributors with close proximity to their retailer network and local connections, will cater to local tastes with regional brands. Online players with centralized procurement function will be slow or unable to adequately capture localized customer preferences, thereby limiting their distribution dominance to National Brands and Larger Pack Sizes, similar to modern trade.

Traditional distributors should think beyond working capital management for their principal brands and offer a bouquet of customer services – convenience in order management, shorter fulfilment cycles, category aggregation for basket shopping experience, financial services, inventory management and accounting support. Partnerships with fintech, logistics tech and aggregator platforms can deliver these services at optimized cost.

Traditional distributors are also likely to backward integrate and reduce costs to pass on incremental margins to customers (Retailers). 3PL and warehousing operations for principal brands are one opportunity. Private label product introduction through contract manufacturing, leveraging the vast MSME ecosystem is another opportunity to explore. Further, this would enable Unorganised or Local brands to gain more visibility as their inability to set up penetrated distribution networks impacted retailer reach.

FMCG companies, today depend on Nielsen’s retailer surveys to determine retail market shares and consumer purchase patterns. With technological intervention in order placement and fulfilment, real time and more accurate data would be available with Online marketplaces for brand analytics. These analytical insights will allow FMCG companies to roll out customized trade promotions, reorganize sales force, their beat plans and shorten product launch cycles.

The net result in a decade’s time would be a more consolidated universe in FMCG distribution, with customers – retailers & consumers benefiting the most with a wider choice for purchase, consumption and business support.

Sources:

  1. https://entrackr.com/2022/01/udaan-revenue-shot-up-6x-to-rs-5919-cr-in-fy21/
  2. Ministry of Corporate Affairs, filings from companies
  3. Company websites and annual reports

How to address the Channel Conflicts in FMCG Distribution?

How to address the Channel Conflicts in FMCG Distribution? 602 401 qwixpertadmin

Introduction

We would remember the times when grocery lists were an ubiquitous phenomenon. The local grocer or the kirana was the recipient of these lists at the beginning of every month from households in the catchment area he served. The need to deliver these lists in person or over the phone to the grocer for pick-up or delivery later in the day is slowly starting to become a thing of the past. Grocery marketplaces, some with instantaneous delivery options (quick commerce), have offered an abundance of convenience to the Indian customer. The easiest way to shop has become via the smartphone and essentials reach home in as little a time as 10 minutes. Convenience and technology led order placement is not limited to the end user and is also an option for the grocer. B2B digital marketplaces have disrupted the traditional FMCG distribution channels. The pace of this disruption and the subsequent channel conflict it has triggered has asked more questions than FMCG companies have answers to. This article analyses the genesis of these conflicts and predicts the direction the FMCG distribution model is likely to take going forward.

E-Commerce is outpacing traditional channels in the $110Bn FMCG market

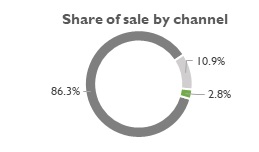
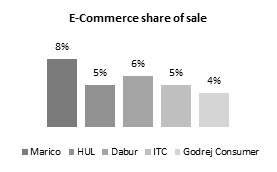
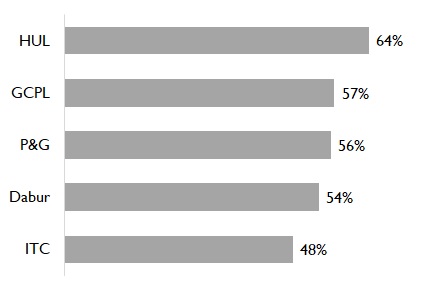
The Indian FMCG market was valued at US $110 Bn in 2020 and is expected to double by 2025 to $220 Bn1. This growth is being driven by growth in rural markets, which are forecasted to beat the urban markets in consumption by 2025. FMCG retail landscape in India is dominated by traditional trade with its mom-and pop stores sells which accounts for ~86% the market (Fig 1). Digital channels including E-Commerce and D2C (Direct to Consumer) are growing much faster than the traditional channels, with Accenture estimating that top FMCG companies derive ~7 – 8%2 of sales from these channels. Marico’s E-Commerce business contributed ~1% in FY173 and has grown to 8% by FY214. Dabur’s E-Commerce business has tripled in saliency from ~2% in Q2FY21 to ~6% in Q2FY225. ITC has seen similar progress with the digital channels contributing to 7% in Q2FY226 as against 5% in FY21 and ~2.5% in FY207. This increase is spurred by the disruption by marketplace platforms such as Big Basket, Udaan, Dunzo, Amazon Pantry, Flipkart, Jio Mart.
General Trade Modern Trade E- Commerce

Fig 1: FMCG sales split by Channel – 2020     

Fig 2: E-Com contribution in leading FMCG firms

With the ease of access to digital infrastructure, there has been a rise in the number of internet users. According to the Ministry of Electronics and Information Technology (MeitY), there were 448 Mn active social media users in India in February 2021. This in turn has influenced online shopping trends with social media being the biggest customer acquisition channel. On the other end of the shopping spectrum, lies the General or Traditional Trade.

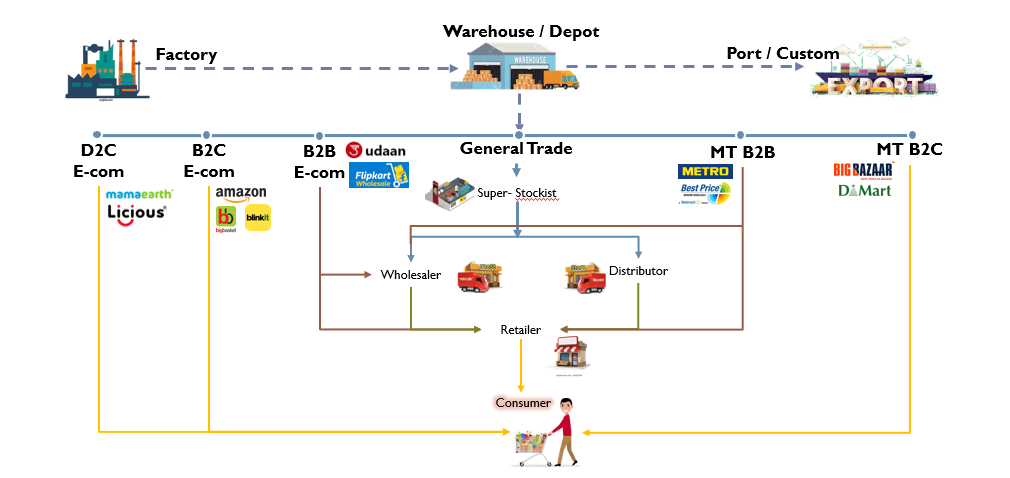
The general trade with ~13 million outlets and Modern trade with ~18,000 outlets (as per Nielsen estimates) sold FMCG products to customer. With the advent of technology, a customer today can approach alternate channels such as social media, marketplace platforms or company websites and apps for their favorite brands. Social commerce, reseller models and O2O (Online to Offline) have emerged as popular alternative channels in China and have enabled disruption across all retail categories – Food to Furniture to Fashion. The FMCG distribution model in India now has at least 7 unique channels, substantial in market size as shown in Fig 3.

Figure 3: FMCG Distribution Channels

Coverage gaps and enhanced technology penetration enabling B2B E-Commerce advent
With the advent of new channels – D2C, E-Commerce – the FMCG customer or channel partner is set to gravitate towards to online channels steadily over time. This migration is expected to be sharper in urban markets, accentuated by the COVID-19 pandemic. The Chinese Urban FMCG market has seen a near 20%+ increased contribution from E-Commerce in a mere 5 year period (Fig 4), with a growth rate of nearly 35% YoY. The Indian economy is expected to follow a similar trend, even if not at such a frenetic pace.

Fig 4. Share of retail sale by channel – China FMCG Urban market

Traditional distribution channels in India contribute to 86% of the FMCG business but direct penetration of even FMCG leaders are ~60% (Fig 5). FMCG companies have coaxed, incentivized and disincentivized traditional distributions to ensure direct coverage, only for the distributors & wholesalers to successfully argue against it with the financial unviability of a direct distribution model. While a vast majority of the remaining 40%, primarily in rural geographies, get covered through indirect distribution (wholesalers, retailer -> retailer purchase), challenges remain in logistics, lower margins for channel partners and higher than MRP prices for customers.

Fig. 5. Direct Customer Penetration

These challenges have paved the way for B2B E-Commerce firms to enter, disrupt, plug coverage gaps and offer value added services to both FMCG companies & retailers. Companies like Elastic Run, Udaan, Jio Mart are being operated on this premise and are unicorns today.

Rise of channel conflict between traditional distributors and B2B e-commerce

With the emergence of B2B E-Commerce, urban markets have emerged early adopters, transferring a share of the pie from traditional distributors to these online platforms. Competition has given way to channel conflict and the FMCG firms are caught in the crosshairs. The new year of 2022 brought new challenge for major brands. In the month of January, distributors in Maharastra9, went on a strike and stopped selling HUL products, followed by distributors of colgate palmolive. Dhairyashil Patil, President of The All India Consumer Product Distributors Federation10 and The Maharashtra State Consumer Product Distributors Federation (MCPDF), told Business Line that the decision was taken due to brands refusal to engage with them on their concerns regarding the lack of price parity between traditional distributors and organised B2B distributors (Jio Mart, Metro, Walmart and Udaan).

All India consumer products distributor federation11 alleged that FMCG companies were selling products at lower prices to B2B distributors and further the organized B2B distributors were selling the same products to retailers at a lower price. In response to the AICPDFs concerns, Amul and Parle have stopped direct supply to Udaan12. Other large FMCG organizations such as HUL, Marico have acknowledged the issue publicly and have promised credible steps13 to support fair returns on investment for their general trade distribution channel.

We at Qwixpert have spent time analyzing the issue in depth and also offer solutions to FMCG organizations to address channel conflict.

The E-commerce distribution model offers an attractive value proposition

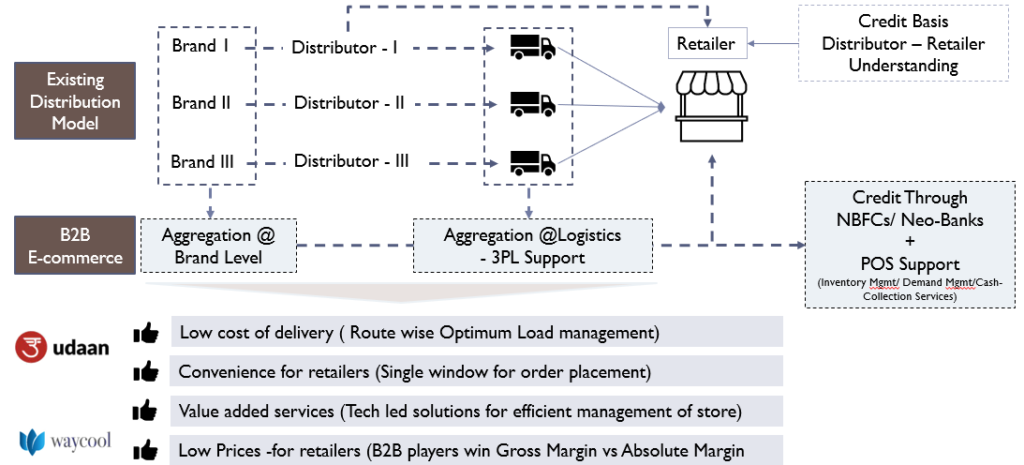
Let us start by understanding the operating model and value proposition of emerging B2B distributors such as Jio Mart, Udaan, Elastic Run and others, to both the FMCG players (suppliers) and Retailers (customers). Convenience through technology enablement, value added services and network effects of supply & demand consolidation are core principles of operation (Fig 6).


Fig 6: Value proposition – B2B E-Commerce

  1. Multicategory demand aggregation – unlike traditional distributors B2B E-commerce players are product category and brand agnostic leading to many advantages.
    • Retail & geographic demand aggregation reducing unit cost of logistics
    • Ability to pass on lower cost of operations to retailers by offering higher margins
  2. Optimized outbound logistics for FMCG brands – B2B E-Com players can in the future replace super stockists & stockists, reducing cost & complexity in downstream operations
  3. Enhanced penetration and coverage – Shared logistics across categories and retailers allow B2B E-Commerce players to viably supply rural & remote geographies
  4. Door-step delivery – No more visits to multiple wholesalers will unburden retailers
  5. Credit facility – Partnerships with financial institutions (including new age fintech firms) offer similar or better credit options to retailers in comparison to the GT distributor’s terms or those from local unorganized networks
  6. Value added services – With the use of IT based solutions, B2B e-commerce players offer full stack app-based platform to place purchase orders and other services such as billing software, stock return indents, inventory management, fintech linked cash & loan collection, automated order replenishmen

B2B E-commerce business’ income streams threatens multiple business models

The value proposition, as noted above, substantially elevates the nature of competition to traditional distribution channels. This coupled with the potential to derive income from several new income streams can alter the very foundation of FMCG distribution in India.

Control over the demand data allows B2B E-commerce players to offer Private Label products, especially in categories with lower brand loyalty. This will adversely affect revenues of FMCG brands. Partnership fees with various service providers who digitize general trade operations – accounting, financial services, inventory & demand management. Some companies have even launched their own fintech arms. The digital platform and marketplace business model offers monetization opportunities – digital marketing – search & display ads, brand promotions, charges on fulfilment services, listing & discovery fees, sale of demand data post analytics to brands.

These income streams disrupt multiple industries and functions – Asset light approach to retail sale data will impact retail research agencies like Nielsen and Kantar, Private Label sales opportunities will promote massive contract manufacturing opportunities for MSMEs and demand aggregation may make sales organizations leaner in traditional FMCG firms. The general trade distribution model also offered higher visibility over retailer sales data with sales people collecting & servicing orders. Loss of control over this data gold mine and the evidenced success of private label in global markets, have made FMCG firms circumspect.

FMCG brands can invest in assets, new partnerships & technology to address conflict

Despite general trade being the major source of distribution in India for decades, ~50 – 60% direct retail coverage creates a just cause for E-commerce businesses. The growing Indian market allows for both traditional and e-commerce channels to co-exist profitably although the status quo will have to change. FMCG brands can take several steps to resolve channel conflict and achieve inclusive growth across channels.
Channel conflict is not new to FMCG business – was seen when modern trade emerged. Most notably, consumer electronics has seen an aggressive version of this conflict with the emergence of E-Com marketplace platforms.

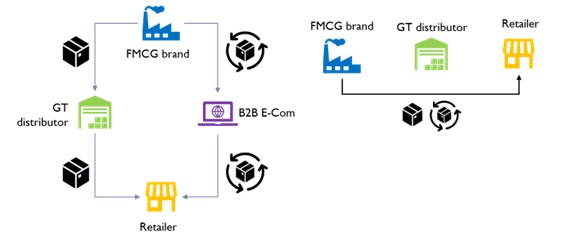
  1. Channel exclusivity among products and categories is often the preferred solution. However, this solution may not offer long term equilibrium in the current environment.
  2. FMCG firms are also experimenting with a direct to retailer delivery model, which bypasses the traditional distributor in their value chain. Thereby ensuring full visibility over demand data. Asian paints has successfully been operating this model for several years, offering higher service levels & customer satisfaction to its retailer partners. Qwixpert is engaged with a leading FMCG brand in evaluating this distribution model.
  3. Direct to retailer distribution model also needs a relook at warehouse networks – locationally, structurally and operationally. Investment in technology, Automated Storage & Retrieval Systems, Robotic picking, conveying and sortation systems, become critical to manage higher order complexity & throughput.
  4. Co-opetition (Collaborate competition) among brands are critical to support traditional distributors. Demand aggregation among FMCG brands in non-competing categories by offering multi-brand distribution will improve General Trade distributor RoI. Co-opetition is not new to the distribution business environment. Automotive (Eg: Autonation, Penske) and consumer electronics (Eg: Redington, Ingram) players have long followed this in the west. Best practices from these models can be identified and emulated.
  5. Technology enablement of General Trade Distributors is another solution. Leveraging 3rd part services from logistics (eg: Delhivery, Shadowfax) to facilitate last mile delivery with synergies in demand aggregation, Point of Sale technology solutions (payment gateways, order management, fulfilment, accounting & GST filing) and fintech partnerships for easy credit can ease the burden on distributors both operationally and financially. Working capital locked up can be freed and profit margins become higher.

Fig 7: Channel exclusivity and Direct to Retailer distribution

Fig 8: Multi-brand General Trade distribution system with Competitive services

Conclusion
Technology adoption in the country is rising at a frenetic pace. With the emergence of B2B marketplaces, traditional processes have been disrupted and the ensuing channel conflict is now unavoidable. The future state of equilibrium will iron out inefficiencies but must ensure an equal competitive platform for traditional and online marketplace channels. A win-win scenario does exist but it is not a quick fix. The higher degree of convenience and lower cost of service will gravitate retailers towards to B2B E-Commerce companies unless the FMCG brands and distributors equip themselves adequately.

The traditional channel of distribution must undergo massive changes in its operating model to remain competitive. FMCG companies must invest in distributor operating model upgrades. Partnerships with fintech, logistics and point of sale technologies will equip general trade distributors to compete with online channels and also reduce their costs and working capital pressures. Consolidation of general trade distribution similar to global models in automotive and electronics industries is expected.

– Giridharan Raghunathan and Ayushi Barnwal

Sources:
1. https://www.ibef.org/download/FMCG-September-2021.pdf
2. https://www.livemint.com/industry/retail/ecommerce-emerging-as-bigger-retail-channel-11623690512609.html
3. https://marico.com/investorspdf/Marico_-_Harnessing_Digital_-_Arisaig_Partners_Consumer_Symposium_2017_-_September_17.pdf
4. https://www.livemint.com/companies/news/heres-how-much-e-commerce-is-contributing-to-sales-of-large-fmcg-companies-11626611943905.html
5. https://www.businesstoday.in/latest/corporate/story/dabur-india-q2-profit-rises-20-to-rs-482-crore-e-commerce-biz-grows-over-200-277548-2020-11-03
6. https://www.business-standard.com/article/companies/itc-doesn-t-rule-out-listing-infotech-biz-open-to-creating-value-for-fmcg-121121401480_1.html
7. https://www.livemint.com/industry/retail/itcs-fmcg-sales-via-e-commerce-doubled-in-fy21-11626348915830.html
8. https://www.bain.com/insights/a-sudden-slowdown-in-2021-fmcg-recovery/
9. https://www.thehindubusinessline.com/companies/now-distributors-to-block-hul-colgate-products-in-4-more-states/article38094485.ece
10. https://www.thehindubusinessline.com/companies/after-hul-maharashtra-distributors-to-stop-selling-products-of-other-fmcgs/article38081998.ece
11. https://www.livemint.com/industry/retail/fmcg-distributors-seek-level-playing-field-threaten-firms-of-noncooperation-11638771763050.html
12. https://economictimes.indiatimes.com/tech/startups/amul-parle-others-stop-direct-supply-to-b2b-startup-udaan/articleshow/85964942.cms
13. https://www.thehindubusinessline.com/companies/after-hul-maharashtra-distributors-to-stop-selling-products-of-other-fmcgs/article38081998.ece

Ethanol Blending Program – What is the opportunity for Indian manufacturers in Ethanol production and why it can precipitate a “Gold Rush” moment?

Ethanol Blending Program – What is the opportunity for Indian manufacturers in Ethanol production and why it can precipitate a “Gold Rush” moment? 979 489 qwixpertadmin

Executive summary

India imports ~84% of its oil requirement. Ethanol Blending Program (EBP) is being promoted with vigour to help conserve foreign exchange, provide massive employment opportunities, increase farm incomes, reduce petrol prices and meet carbon emission targets. Oil Marketing Companies, with direction from the Government of India, are placing substantial orders for Ethanol to meet the 10% EBP target by 2022 and 20% by 2025. However, we are facing a massive shortfall in production. As against a target requirement of 900 Cr. litres annually, India’s current annual capacity is 467 Cr. litres. Interest subventions, capital subsidies, tax waivers etc. are expected to prop up interest among manufacturers to invest in Ethanol production across the country. 361 projects have been approved in-principle to produce ~444 Cr. litres annually. State level schemes are expected to take this number higher as investors are enticed with additional benefits. Bihar has become the 1st state to launch an Ethanol Production Promotion Policy. More states are following suit with attractive schemes.

India’s oil import dependence is very high and needs immediate solutions

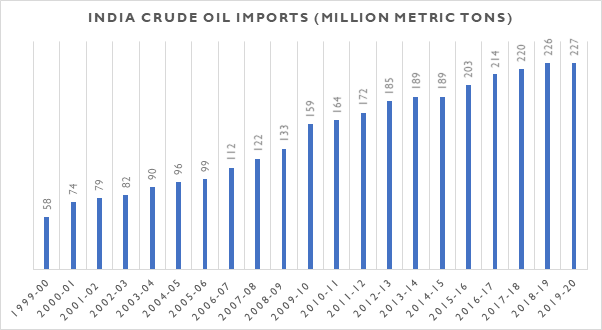
In a worrying forecast, BP Energy Outlook 20201 estimates that India’s oil and gas import dependence will double by 2050. At 84%2 oil import dependence, India imports ~227 Mn metric tonnes3 of Crude Oil every year. India has seen a quadruple rise since 1999-00 in its oil imports when ~57.8 Mn. Metric Tonnes of crude oil were imported. Although the growth in oil imports has slowed from 10.7% YoY in the 2000 – 2010 vs ~3.6% YoY in the 2010 – 2020 period, reducing import dependence on a long-term basis is more critical than ever.

Fig1: India Crude Oil Imports – FY2000 to FY2020; CAGR = Compound Annual Growth Rate

The National Policy on biofuels-2018 has been drafted with the express need to reduce fossil fuel import dependence by 10% in 2022 from the 2014-15 levels. The Indian Prime Minister has stated in multiple forums that India’s oil dependence is to be brought down to 67% by 2022 when the country would celebrate 75 years of independence4. The goal also was critical as reducing oil imports would mean conservation of foreign exchange, lesser carbon emissions, lower fuel prices for the common man and an opportunity for indigenous entrepreneurs / products. With a growing economy this has been a difficult dream to achieve.

Ethanol Blending Program can help reduce import dependence but has progressed slowly

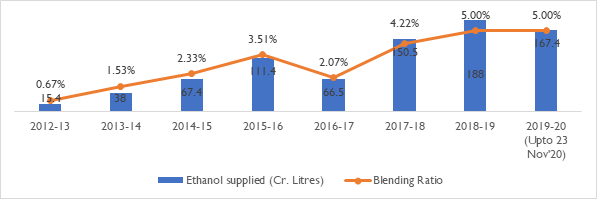
Ethanol Blending Program (EBP) has been identified as one of the levers to achieve this goal. The program started in 2003 with a resolution to sell 5% Ethanol Blended Petrol in 9 states and 4 Union Territories. This was made possible by distilleries using excess raw material (molasses or sugarcane) to produce ethanol. As sugarcane production faced a glut, this provided a succour for farmers who had to otherwise sell their harvest at extremely low prices. The benefits for all stakeholders involved was obvious and the country took to it in earnest. However, sugarcane production would not be abundant enough to meet future targets of 10% EBP by 2008 or 20% at an unset future date. Despite these initiatives, ethanol blending took off only post 2014.

Fig2: Ethanol Blending in Petrol – Blending quantity and ratio. Year is calculated between Dec – Nov5,6

The subsequent National Policy on Biofuels set out to address supply issues. The extension of ethanol as biofuel production from non-sugarcane sources such as cellulose, lignocellulose was also found insufficient to meet EBP targets. The ethanol that is produced is being used for other purposes as well – As ENA (Extra Neutral Alcohol) for alcohol production (Indian Made Foreign Liquor and Indian Made Indian Liquor) and as Industrial alcohol. Diversion of alcohol production to ethanol will have severe ramifications from a societal and economic standpoint. These have made the government look for alternate sources.

National Biofuel Policy, 2018 incentivizes ethanol production with affirmative measures

In 2018, the policy widened the scope to include feedstock. Further, the Government announced a reduction of GST from 18% to 5% on denatured alcohol. An interest subvention scheme for manufacturers – “Scheme for augmenting and enhancing ethanol production capacity”. Further, the Government has periodically revised upwards, the price of procurement by OMCs to ensure sustainable revenue generation for ethanol manufacturers. The price for ethanol from sugarcane juice, sugar, sugar syrup is now at Rs. 62.65 per litre, B-heavy molasses ethanol at Rs. 57.61 per litre and C-heavy molasses ethanol at Rs. 45.69 per litre. GST and transportation charges are also additionally payable by OMCs7. OMCs have also fixed the Basic Rate of procurement for ethanol from Damaged grains at Rs. 51.55 per litre and from surplus rice procured from Food Corporation of India at Rs. 56.87 per litre.

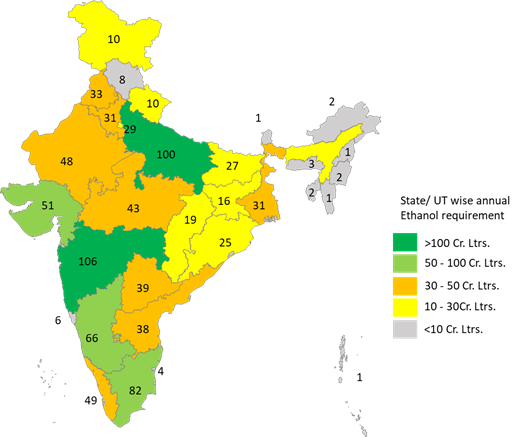
Fig 3: State wise Ethanol requirement for blending in Cr. Ltrs by 2024-25 to achieve 20% blending

Fuelled by these positive forces, the Ethanol Supply Year 2020-21 (Dec’20 to Nov’21) has seen record blending rates. In the first 4 months (Dec’20 to Mar’21), 100 Cr. litres have been supplied leading to a blending rate of 7.2%8. Several states – Goa, Maharashtra, Karnataka, Gujarat, Uttar Pradesh, Haryana, Uttarakhand, Punjab, Delhi and Himachal Pradesh – are also close to achieving the 2022 target of 10% EBP. Sugar industry predicts India could end the year with an 8% EBP.

Steep targets for 2022 and 2025 and supportive Government schemes are expected to fuel future demand; Departments are clearing projects at breakneck speed

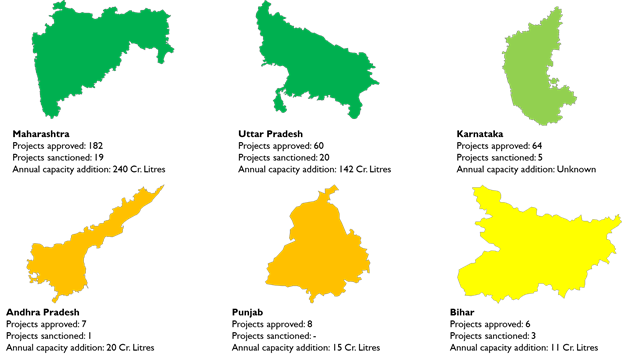
With the government targeting 20% blending by 2024-25, Ministry of Consumer Affairs, Food & Public Division estimates the annual requirement to be 900 Cr. Litres9. However, with a total supply capacity of only 427 Cr. Litres and highest annual supply for EBP @ 188 Cr. Litres, India faces a huge shortfall to achieve this target. This indicates the massive push for new projects setting up ethanol production across the country. As per the ISMA (India Sugar Manufacturer’s Association), the Department of Food & Public Distribution has approved 361 projects which will increase capacity by an additional 444 Cr. Litres / annum. 53 projects which will contribute 62 Cr. Litres / annum have already received sanction and disbursal under the interest subvention scheme.

6 states, Uttar Pradesh, Maharashtra, Karnataka, Andhra Pradesh, Punjab and Bihar have evinced maximum interest from manufacturers due to their proximity to raw material – Sugarcane / Molasses and Feed stock (Maize, Rice etc.). The approved projects have also been extended soft loans from banks and the approximate interest subvention is expected to be Rs. 4,045 Cr. for a period of 5 years.

Individual states are following the Central Government and want to cash in on the vast employment generation opportunity

Bihar, has gone ahead by becoming the 1st state to introduce an ethanol production promotion policy11. Apart from the interest subvention offered, the policy has several additional perks for investors.

  • The policy permits production of ethanol from all feedstock, including surplus quantities of maize.
  • A 15% capital subsidy on the cost of the plant and machinery up to a maximum of Rs. 5 Cr.
  • Additional capital subsidies (0.75%) or upto a maximum of Rs. 5.25 Cr. for special class of investors – SCs/ STs/ EBCs/ Women, differently-abled, war widows, acid attack victims and third gender entrepreneurs
  • Stamp duty and registration are also to be waived off while land conversion fees is expected to be revoked

To attract investments, subsidies, incentives & schemes as part of Ethanol Production & promotion policies are being offered by every state. For instance, the policy laid out by the Jharkhand Government12 has proposed a 25% subsidy on fixed capital upto Rs. 50 Cr. for non-MSMEs and Rs. 10 Cr. for MSMEs. Further, employee skill development subsidies worth Rs. 13,000 per employee and monthly ESI & EPF contributions to the tune of Rs. 1,000 per employee for a period of 5 years are also expected.

Other states are also expected to follow suit as India has moved forward the EBP target of 20% from 2030 to 2025. These present a massive opportunity to ethanol manufacturers while ensuring India saves Rs. 12,000 Cr. worth of oil imports over the next 4 years.

The diversion of molasses & sugarcane to ethanol production is expected to impact Extra Neutral Alcohol and Rectified Spirit manufacturing. Distilleries have modified their distillation columns to produce the more remunerative ethanol. IMFL manufacturers are hence looking to ringfence sourcing through own investments, long-term sourcing contracts and backward integration to protect raw materials such as molasses and broken rice.

About the Authors:

Mr. PN Poddar

Mr. Poddar is a Former, Senior Vice President and Head of Distillation, United Spirits Ltd. He has over 40+ years of experience in design, set-up, commissioning and profitable operation of distillation plants for Ethanol, Extra Neutral Alcohol, Malt Spirit production and ZLD (Zero Liquid Discharge) systems.

Mr. Giridharan Raghunathan

Giri has 9 years of management consulting experience. Giri specializes in Food & Beverages, Retail and Automotive sectors. He leverages customer insights and analytics to drive growth and profitability for his clients.

References: 

  1. Our Bureau (2020), “India’s oil and gas import dependence to more than double by 2050: bp Energy Outlook 2020”, The Hindu Business Line, 14 Sep. Available at: https://www.thehindubusinessline.com/economy/indias-oil-and-gas-import-dependence-to-more-than-double-by-2050-bp-energy-outlook-2020/article32600221.ece
  2. PTI (2019), “India’s oil import dependence jumps to 84 per cent”, The Economic Times, 05 May. Available at: https://economictimes.indiatimes.com/industry/energy/oil-gas/indias-oil-import-dependence-jumps-to-84-pc/articleshow/69183923.cms?from=mdr
  3. Data for crude imports and exports. Available at: https://www.ppac.gov.in/content/212_1_ImportExport.aspx
  4. PTI (2019), “India on track to cut oil import dependence by 10 per cent by 2022: Pradhan”, 06 Nov. Available at: https://energy.economictimes.indiatimes.com/news/oil-and-gas/india-on-track-to-cut-oil-import-dependence-by-10-per-cent-by-2022-pradhan/71937504
  5. Anjan Ray (2020), “World Biofuel day webinar: Biofuels for Atmanirbhar Bharat: Bio-ATF and Room temperature Biodisel”, 10 Aug. Available at: http://petroleum.nic.in/sites/default/files/WBD_10aug20.pdf
  6. Ethanol Blending status. Available at: https://www.bharatpetroleum.com/pdf/EBP-Programme-progress-23-11-2020-d3ad1d.pdf
  7. PIB Delhi (2020), “Cabinet approves Mechanism for procurement of ethanol by Public Sector Oil Marketing Companies under Ethanol Blended Petrol Programme – Revision of ethanol price for supply to Public Sector OMCs for Ethanol Supply Year 2020-21”, 29 Oct. Available at: https://pib.gov.in/PressReleseDetail.aspx?PRID=1668399
  8. Mukherjee, Sanjeeb (2021), “At 7.2%, India blends record ethanol with petrol in first 4 months”, Business Standard, 05 Apr. Available at: https://www.business-standard.com/article/economy-policy/at-7-2-india-blends-record-ethanol-with-petrol-in-first-4-months-121040500016_1.html
  9. Ministry of Consumer Affairs, Food & Public Distribution, Depart of Food & Public Distribution (2021), “Implementation of Policy for extending financial assistance to project proponents for enhancement of their ethanol distillation capacity or to set up distilleries for producing 1st Generation (IG) ethanol from feed stocks such as cereals (rice, wheat, barley, corn & sorghum), sugarcane, sugar beet etc. – Reg.”, 14 Jan. Available at: https://sugarethanol.nic.in/assets/Pdfs/LetterofImplementationofpolicy.pdf
  10. Industry Research (2020), “Ethanol capacities, supplies and targets: October 2020”, 14 Oct. Available at: https://www.careratings.com/uploads/newsfiles/Ethanol%20Capacities%20Supplies%20and%20Targets%20October%202020.pdf
  11. Arora, Sumit (2021), “Bihar becomes first state to have own ethanol policy”, Current Affairs Adda 247, 22 Mar. Available at: https://currentaffairs.adda247.com/bihar-becomes-first-state-to-have-own-ethanol-policy/
  12. PNS (2021), “25 % subsidy for investors for ethanol production” Daily Pioneer, 28 Jul. Available at: https://www.dailypioneer.com/2021/state-editions/25—subsidy-for-investors-for-ethanol-production.html

How will the addition of 2 new teams impact the P&L of current teams?

How will the addition of 2 new teams impact the P&L of current teams? 660 726 qwixpertadmin

The pandemic has changed the lives of millions across the globe, personally and professionally. Entertainment is no outlier, with India’s cricket-crazy fan base missing the experience of live matches. The 2020 IPL season was a much-awaited bloom in the drought. BARC India’s viewership data indicates an overwhelming response to IPL 2020. 405 million viewers tuned in to watch the IPL. Indian audiences consumed 400 billion minutes of IPL this year, leading to a 23% increase in consumption over the previous year.

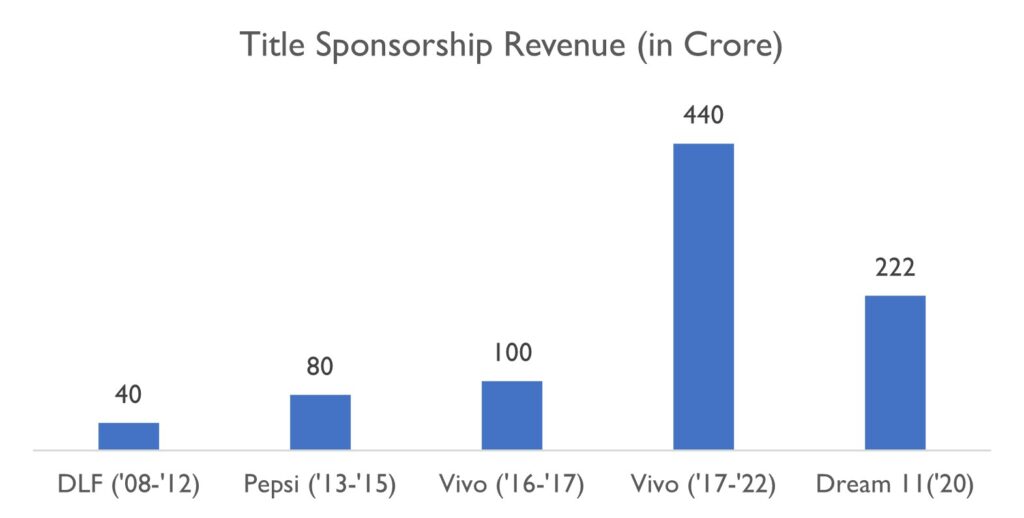
The franchise finances have, however, taken a hit this year. Revenues dropped significantly due to the lower title sponsorships (Vivo’s Rs. 440 Cr. vs. Dream 11 Rs. 222 Cr.), reduced jersey sponsorships, and loss of match day income due to the shifting of venues to Dubai.

Will adding two new franchises be a boon or a bane for the existing franchises? If added, how will it further affect the business prospects of existing franchises?

Teams may have to take home a lower share of the broadcasting rights revenues – their major revenue contributor

Currently, the eight teams play a total of 56 matches in a league format (both home and away) and 4 matches in the knockout round, resulting in a total of 60 matches. If the BCCI members (state associations) approve two new teams in the annual meeting in December end, it will not be the first time the IPL has had ten franchises in a season. In 2011, BCCI added Pune Warriors and Kochi Tuskers to the original roster of eight franchises. The home-and-away format, which would have meant a total of 94 matches, was shelved due to fear of burnout. Consequently, the IPL split the ten teams into two loose groups with 70 league matches and four playoff games. Teams, though, were ranked together in one composite league table.

The proposal by BCCI for the new IPL format, if the two new teams are added, is that during the league phase, every team will play the same number of league matches (14) as of today. The teams will be split into two groups of 5. Each team will play the other four in their group, in both home and away format (8 matches), four of the teams in the other group once (4 matches, either home or away), and the remaining team in the other group twice, in both home and away. A random draw will decide the groups’ composition and who plays whom across the groups once and twice.

The broadcasting rights revenue of Rs 3,200 from Star India is less likely to increase with the addition of 2 new teams, especially with the tournament length unchanged. Hence the central rights share given to the franchises is expected to remain the same at Rs 1,600. The addition of 2 teams may lead to the existing teams getting a 20% (Rs 40 Cr) lesser share of central revenue. While the title sponsorship fell by ~50% in IPL 2020, it is expected to increase in 2021 and beyond as the tournament returns to India.

Franchisees must leverage sponsorships and brand extensions to offset rights income drop

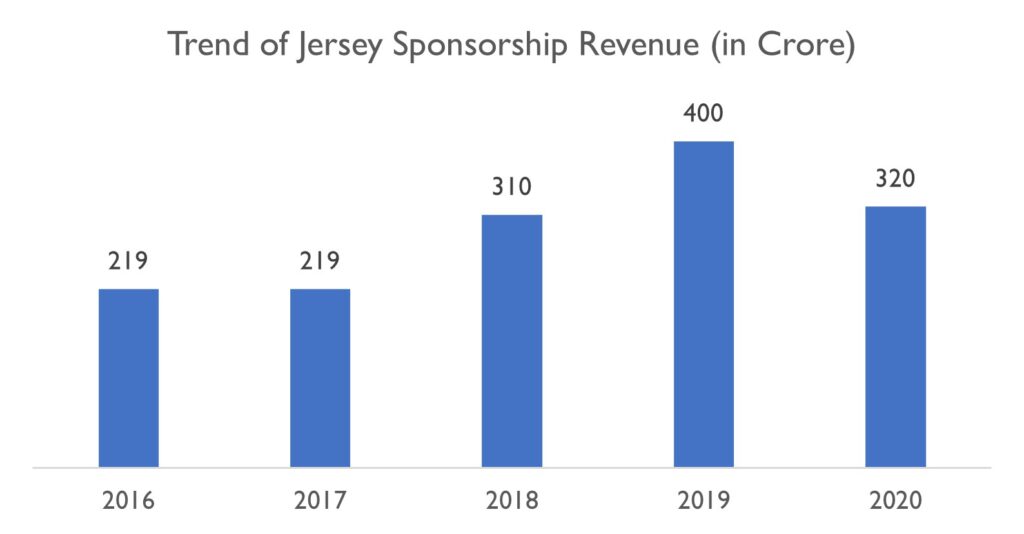
Leading franchises have seen a 10-15% decline in 2020; for the rest, sponsorship amount has dropped by 25-30%. This year the eight franchises are estimated to have earned anywhere between Rs 300-350 crore, compared to Rs 400 crore last year.

The top four franchises earn between Rs 70-80 crore from sponsorship, while the remaining four franchise’s earnings ranges from Rs 30 to Rs 40 crore. Even as franchises could close most of the deals before lockdown, a lot of the inventory, such as space at the back of the helmet, non-leading arm, remained unsold.

From 2016 – 2017 the eight teams’ total sponsorship revenue remained flat at Rs 219 crore. In the 2018 edition of IPL, sponsorship revenue grew by 37% – 46%. The total sponsorship pacts signed by the eight teams were in the range of Rs 300–320 crore.

Sponsorships are dependent on the team’s star players and fan base. New franchisees may struggle to generate much in the initial seasons. However, the existing franchisees having an established core group of international stars and cultivated a loyal fan following will continue the growing trend. Brand extensions will become significant as teams identify ways to engage fans even beyond the IPL season. RCB Bar and Café, inaugurated on 19th Dec in the heart of Bangalore, is a case in point.

Ticketing Revenue may shrink by ~10% – 15% with lower home matches/team; a holistic approach to augmenting in-stadium revenues imperative

BCCI, in the past, had compensated franchises when the T20 tournament moved out of India to countries such as South Africa and UAE – the situation was different this year. The teams had to let go of earning from the ticket sale, which amounts to ~Rs. 400 crore. While upcoming seasons are expected to happen in India, 1 or 2 lesser home matches/team indicates lower earnings. With occupancy at ~87% overall, teams will have to maximize seat utilizations through intelligent use of analytics and augment in-stadium revenues with activities engaging fans pre- and post-matches.

Conclusion

BCCI’s AGM on 24th Dec 2020 is likely to pass the proposal to add two new teams to the IPL. It is expected that the 2021 season will remain unchanged with a mini-auction in February. The 2022 season will start with a mega auction at the beginning of 2022. This allows sufficient time for franchisees to prepare in the back end – with coaching and support staff, talent scouts identifying potential auction picks, sponsorship and marketing planning, stadium preparation, and pre-season fan engagement.

BCCI may tweak the share of central rights income from 50:50 to 60:40. While this impacts BCCI’s revenues, the new franchisee bids (Expected @ $300 Mn as per a Times of India report) is expected to compensate for the drop. However, teams must develop self-sufficiency in income generation and not remain overly dependent on the central rights income share. Enriching the in-stadia experience for fans will augment income generation. Fan and sponsor engagement beyond the playing season to generate higher sponsorship and brand extension incomes are critical for long term franchisee viability.

The BCCI’s AGM will throw some light on the upcoming IPL seasons. For the cricket crazy fans at large, the show gets only more exciting.

-By Gopika Hemachander and Maheswaran Ganapathy

What should auto manufacturers do to succeed in the Electric Vehicle era? – Automotive industry’s smartphone moment

What should auto manufacturers do to succeed in the Electric Vehicle era? – Automotive industry’s smartphone moment 774 619 qwixpertadmin

Executive summary

The migration to Electric Vehicles from Internal Combustion Engine technology has gathered pace. Customer anxieties over their purchase and usage, while they remain, are declining. Regulatory authorities, manufacturers, and investors have set themselves ambitious targets and work in overdrive to achieve them. Players across the automotive value chain are facing disruption. Adoption and migration to the new normal are critical to avoid obsolescence. Manufacturers will need to diversify their portfolio, invest in R&D and capability development, cooperate with competition to overcome product obsolescence or end up being upstaged by new-age competitors. Regulatory impetus, a significant reduction in the number of moving parts, and lower cost of ownership will drive manufacturers to innovate through value engineering. More than 90% import of EV components as of date presents opportunities for local substitution. India must continue its global leadership in automotive manufacturing by investing early in EV. Loss of jobs and livelihoods expected across OEMs and OES. The Government needs to step-in with a holistic plan, including revamping the current educational system, to secure careers and develop an EV-specific talent base. Global geopolitics may shift from the Gulf to South America if and when Lithium becomes to new oil.

Electric vehicles technology is disrupting the entire automotive value chain

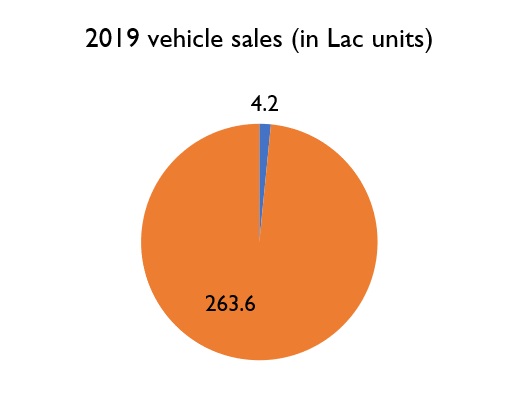
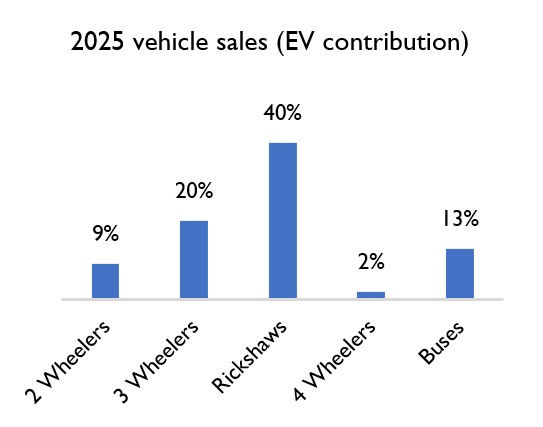
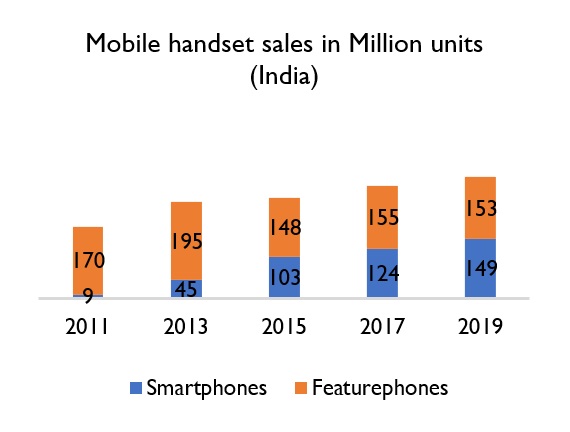
A decade ago, feature phone manufacturers overlooked the disruption from smartphones. The 16x sales growth of smartphones over a decade and a ~50% market share (in 2019) in the mobile handset category (Fig. 3) shares lessons for the automobile industry. The $118 bn automobile industry, contributing to around 7% of the Indian GDP, is expected to contribute over 35 million jobs to the Indian populace. Further, auto exports contribute to Rs. 1.0 lac Cr. earned in foreign currencies. This industry is facing disruption from green/energy-efficient technology, with Electric Vehicles leading the charge. The electric vehicles industry is estimated to grow to Rs.50,000 crores opportunity by 2025. Significant interest is noticed in this relatively nascent market, even as electric vehicles contributed to ~1.5% of the total vehicle sales in 2019. Avendus Capital, in its recent report, expects the contribution from 3W, buses, and 2W to drive adoption soon (Figs. 1 & 2).

Fig 1: Electric vehicles sales (units) – 2019

Fig 2: Key categories for EV sales by 2025

Fig 3: Mobile handset sales Year on Year

The migration to Electric Vehicles is currently slow but expected to disrupt players across the automotive value chain – Manufacturing and Sales & After-sales

Manufacturing includes Original Equipment Manufacturers (OEMs), their suppliers (Tier-1 OES), and their suppliers (Tier-2, Tier-3, and Raw Material manufacturers). Sales & after-sales include many players such as dealerships, energy infrastructure partners, financiers, authorized service stations, unorganized road-side mechanics, spare parts sellers, and branded/unbranded used vehicle network. Customers and regulatory bodies wield considerable influence on each of these players and accelerate or dampen the pace of disruption. In a 2-part series, Qwixpert will elaborate on the key trends, their implications across the value chain, and recommended responses for sustained business performance.

Portfolio diversification, capability development, and product innovation are critical for manufacturers to stay ahead in the EV revolution

  1. Technological readiness and upskilling are imperative for success in the EV era

Electric vehicles are much simpler than their Internal Combustion Engine (ICE) counterparts. As per Avendus’ research, a typical EV has 24 moving parts compared to ICE’s 150 moving parts. A comparison between the two technologies highlights four scenarios. (Fig 4)

Fig 4: Four scenarios due to changing automobile technology – ICE to EV

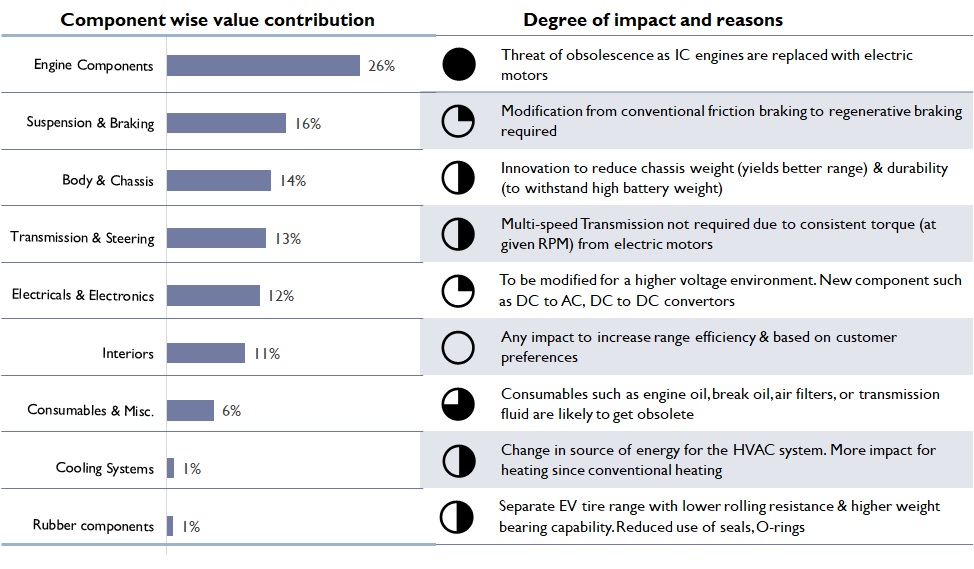
Firstly, several parts are expected to become obsolete. The injection, emission control, and fuel storage systems are no longer needed as batteries replace biofuel energy. Secondly, existing parts may undergo modifications, as multi-speed transmission systems as electric motors deliver power instantaneously. Conventional brakes are to be replaced by regenerative brakes. Tire manufacturers are modifying their designs to develop lower rolling resistance and noise generation. Thirdly, new parts’ requirements come up, such as the battery and electric motors to convert electric energy to mechanical energy. Finally, parts such as body frames, seats, etc., are applicable in both engine classes and will continue.

Fig 5: Impact of EV adoption for each of the auto components

Indian Government has an ambitious vision of ensuring 100% EV by 2030. The implications of these possibilities are currently minuscule due to the low contribution of electric vehicles to the overall automotive sector. The impact of even a 10% migration in vehicle sales to EV will be substantial as the automotive industry employs over 7 million people (2 million by OEMs, 5 million by component manufacturers). There are an additional number of people involved in service stations and dealership networks as well.

The projected impact is twofold. Primarily, product obsoletion will precipitate business closures. MSMEs involved in supplying to Tier-2 and Tier-1 vendors of OEMs will need to shut shop unless a technology migration path to EV is set-up. Secondly, new and modified auto components require new skills. Lower moving parts also indicate automation opportunities, leading to job losses among the semi-skilled or unskilled labour force. There is a compelling need for holistic upskilling to create a sustainable supply of high skilled labour. The Government must ensure new courses and upgrading existing syllabuses of colleges, institutes, and polytechnic centres. In the near-term, manufacturers must spend on upskilling their workforce to remain increasingly relevant.

Auto component manufacturers investing in upskilling and R&D to deliver cutting edge product innovation are expected to succeed in the EV era. Suppliers dependent on principals’ designs to operate a cost-efficient production unit will need to engage principals for business sustenance.

  1. White spaces emerge due to high import dependence; Co-opetition a must among manufacturers

Auto component suppliers must assess their portfolios on the extent of exposure of obsoletion. The suppliers must actively integrate product mix diversification into their business plans to ensure long term business solvency. Companies can also go aggressive in identifying white spaces and quick wins (products with greater synergy with an existing portfolio, good market size, a higher degree of import substitution, and low investment activity at present). The majority of the EV parts (>90%) are imported today due to a lack of manufacturing infrastructure and skill gaps. Products such as the battery, chargers, electronic controllers, power converters, electric motor, and transmission are mostly imported, and these contribute to more than 2/3rd of the cost of an EV. Such import dependency presents a massive import substitution opportunity, especially for early movers. Indigenous OEMs and OES can partner with global EV leaders to fill technological and skill gaps. The Exide-Leclenche JV and Amara Raja-Gridtential Energy partnership are examples in this regard.

Platform approach in passenger vehicle development needs to be extended to electric vehicles to drive down initial costs and encourage faster adoption. Volkswagen has created a 4W EV platform called MEB and has extended it across its subsidiaries such as Audi, Skoda, and Volkswagen. The CMF-EV platform is an extension of Renault, Nissan, and Mitsubishi’s partnership to its Electric Vehicle range. Cooperation among OEMs at a scale never seen before is expected. The platform approach will help faster implementation of technologies such as battery swapping. Anxiety among customers w.r.t adequate post-purchase support catalyzing the pace of adoption. Platform approach and co-opetition to standardize components (especially battery) also support adoption.

  1. New raw materials and battery technology present lucrative investment opportunities

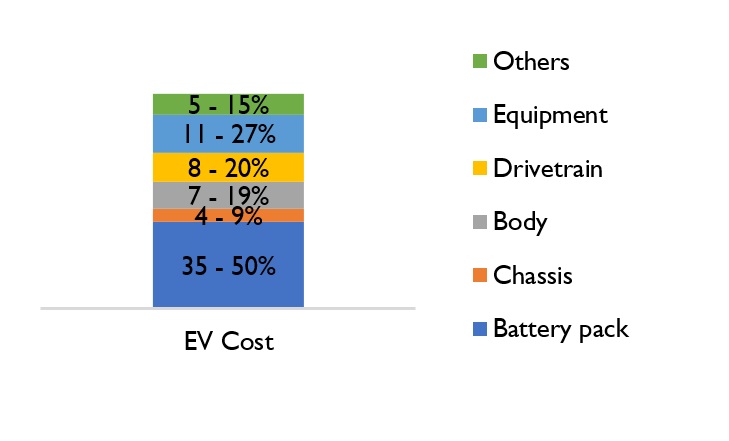
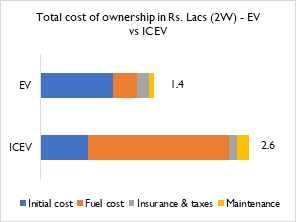
Batteries can make up as much as 50% of the EV cost (Fig 6). Several studies link the lower-paced adoption of electric vehicles to the higher initial cost, and battery technology is intricately connected to the demand. The cost of battery has come down from > $1,100 / kWh in 2008-09 to $156 / kWh in 2018-19. The inflection point for widespread adoption is expected to be $100 / kWh—the experts time this between 2022 and 2025.

Fig 6: Cost of individual components in an EV

China, Korea, and Japan control ~95%+ of global battery production. Countries across the globe are encouraging investments with incentives and subsidies. Manufacturers setting up new facilities in India can expect incentives of up to $25 / kWh. 3 Li-ion battery units with a combined capacity of 10 Gigawatts are expected to be set-up in Telangana with a total investment of Rs. 6,000 Cr. A phased increase in import duties of battery components from 5% to 15% will hasten battery manufacturing indigenization.

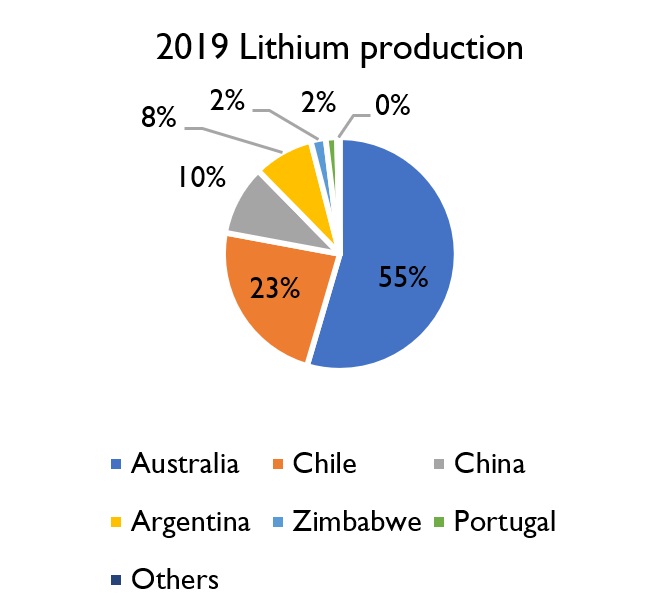
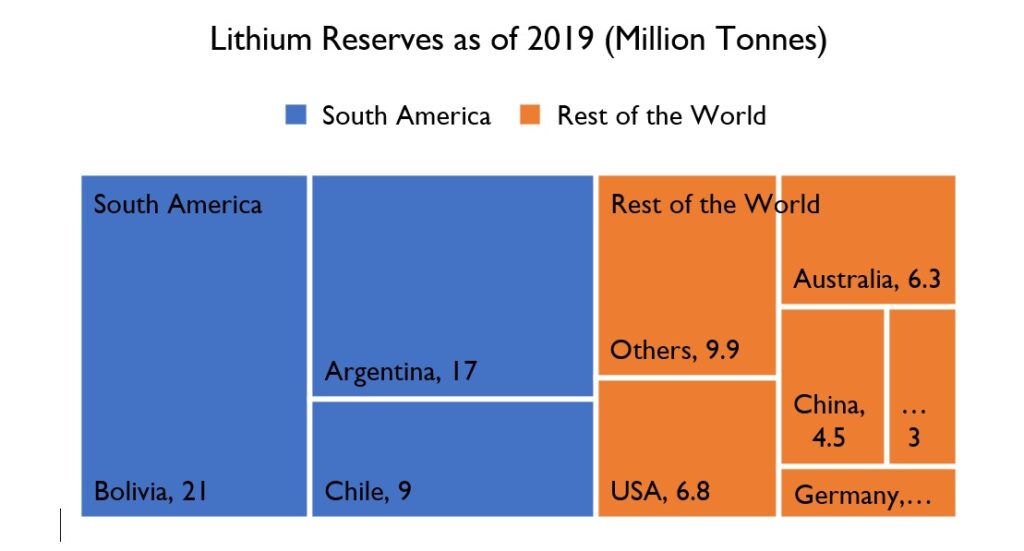
Crude oil prices are seeing a declining trend and are expected to continue in a downward trajectory. Experts across the globe believe the coronavirus pandemic may have accelerated a global energy transition away from oil. Asset write-offs worth $22Bn from Royal Dutch Shell and $17.5 Bn from BP in Jul’20 highlight the hastening pace of decarbonization across the world. Mainstreaming electric vehicles will create massive spikes in demand for raw materials such as Lithium, Cobalt, Manganese, etc., integral to manufacturing rechargeable batteries. The global focus may move away from the gulf to the top Lithium producing countries such as Australia, Chile, and China (Fig. 7). Analysis of the known reserves indicates a prospective geopolitical shift from the Gulf to South America (Fig. 8), if and when Lithium becomes the new oil.

Fig 7: Lithium production across the world

Fig 8: Lithium reserves across the world

Another key trend is suppliers’ investing in value engineering to increase vehicle range by making it lighter using Fibre Reinforced Plastics (FRP) for chassis. Tyres are also undergoing redevelopment to lower rolling resistance without compromising safety and increase fuel efficiency. Disposal, however, is a concern. Less than 5% of all spent Li-Ion batteries are recycled. FRPs cannot be reused, and higher costs of Lithium recycling (vs. mining for new Lithium) has led to inefficient disposal (landfills) with potentially harmful environmental effects.

Further, recycling is essential to harness rarer metals such as cobalt to avoid shortages during widespread adoption. Companies such as Redwood Materials, set-up by Ex-Tesla employees, are hence building recycling and disposal solutions. Current regulations around Li-Ion battery recycling are nascent and do not put the onus on manufacturers, unlike the food packaging industry. If it develops in the future, such a scenario may increase the initial cost to the customer.

Conclusion

Electric vehicles’ impact in the automobile industry is expected to be similar to that of smartphones in the mobile handset industry. Despite Electric Vehicles contributing to only 1.5% of total vehicle sales in 2019, the manufacturing circles are abuzz. With a 50% reduction in moving parts, several Tier-1, 2, and 3 suppliers must assess and diversify their portfolios to future-proof their businesses. More than 90% of the electric vehicle parts are imported, creating massive opportunities in import substitution. However, technology partnerships and rapid upskilling are critical. Early movers are set to gain massively as the Government offers subsidies and increases duties to enable indigenization. Co-opetition through a platform approach for vehicle and component development will benefit the entire manufacturing ecosystem. As battery costs make up 35% – 50% of total vehicle cost, countries with natural Lithium reserves are set to gain. Value engineering to reduce costs and improve vehicle performance are expected to continue as customer anxiety over higher initial investment acts as a key barrier to migration. India must act fast to offer cost-efficient and high-quality manufacturing options to Electric Vehicle players across the world.

Authors: Giridharan Raghunathan, Maheswaran Ganapathy and Rahul Das

Sources:

  1. Kusnetz, Nicolas (2020) “BP and Shell Write-Off Billions in Assets, Citing Covid-19 and Climate Change”, 2-Jul. Available at: https://insideclimatenews.org/news/01072020/bp-shell-coronavirus-climate-change
  2. NS energy staff writer (2020), “Profiling the top six lithium-producing countries in the world”, 23-Nov. Available at: https://www.nsenergybusiness.com/features/top-lithium-producing-countries/
  3. Kohli, Pratati Chestha (2020), “Opportunities in EV battery and cell manufacturing in India”, 2-Jul. Available at: https://www.investindia.gov.in/team-india-blogs/opportunities-ev-battery-and-cell-manufacturing-india
  4. James Eddy, Alexander Pfeiffer, and Jasper van de Staaij (2019), “Recharging economies: The EV-battery manufacturing outlook for Europe”, 3-Jun. Available at: https://www.mckinsey.com/industries/oil-and-gas/our-insights/recharging-economies-the-ev-battery-manufacturing-outlook-for-europe
  5. PTI (2019), Government notifies phased import duty hike on electric PV parts, lithium-ion cells, 11-Mar. Available at: https://economictimes.indiatimes.com/news/economy/foreign-trade/government-notifies-phased-import-duty-hike-on-electric-pv-parts-lithium-ion-cells/articleshow/68363381.cms?from=mdr
  6. Kia official website. Available at: https://www.kia.com/dm/discover-kia/ask/do-electric-cars-have-transmissions.html#:~:text=Electric%20cars%20don’t%20require,RPM%20within%20a%20specific%20range
  7. SIAM website. Available at: https://www.siam.in/statistics.aspx?mpgid=8&pgidtrail=9
  8. India Electric Vehicle Market Overview Report, Indiaesa.info. Available at: https://www.indiaesa.info/media/downloadfiles/EV_Report_Brochure._234429529.pdf
  9. Electric Vehicles, Charging towards a bright future, Avendus. Available at: https://www.avendus.com/india/ev-report
  10. Bajwa, Nehal, InvestIndia. Available at: https://www.investindia.gov.in/sector/auto-components
  11. Craftech Industries. Available at: https://www.craftechind.com/fiber-reinforced-plastic-in-action/
  12. Michael Friesa, Mathias Kerlera, Stephan Rohra, Stephan Schickrama, Michael Sinninga, Markus Lienkampa, Robert Kochhan, Stephan Fuchs, Benjamin Reuter, Peter Burda, Stephan Matz, Markus Lienkamp, “An Overview of Costs for Vehicle Components, Fuels, Greenhouse Gas Emissions and Total Cost of Ownership Update 2017”. Available at: https://steps.ucdavis.edu/wp-content/uploads/2018/02/FRIES-MICHAEL-An-Overview-of-Costs-for-Vehicle-Components-Fuels-Greenhouse-Gas-Emissions-and-Total-Cost-of-Ownership-Update-2017-.pdf
  13. Linda Gaines, Kirti Richa and Jeffrey Spangenberger (2018), “Key issues for Li-ion battery recycling” 22-Nov. Available at: https://www.cambridge.org/core/journals/mrs-energy-and-sustainability/article/key-issues-for-liion-battery-recycling/F37D3914A1F5A8FD0ED3EF901664D126
  14. Dutta, Arnab (2019), “India’s handset industry may go past the 300-mn unit mark in 2019”, 10-Jul. Available at: https://www.business-standard.com/article/companies/india-s-handset-industry-may-go-past-the-300-mn-unit-mark-in-2019-119010401162_1.html
  15. Pathak, Tarun (2017), “Mobile handset market in India”, 29-Nov. Available at: https://indiaincgroup.com/mobile-handset-market-india/

Ola’s road to profitability: What lies ahead for one of India’s favorite unicorns?

Ola’s road to profitability: What lies ahead for one of India’s favorite unicorns? 1080 720 qwixpertadmin

Executive summary

Very few businesses can lay claim to changing the habits of a population. Ola, with its convenient and cost-effective cabs, has changed how India travels. However, the business is yet to sustain itself financially. With the increasing customer acquisition cost for their 4W intra-city taxis and the need to turn profitable, Ola ventured into more cost-effective mobility options (carpooling, autos, 2 wheelers). Recent numbers on # of rides per day show a certain stagnation – 3.5 million/ day in 2018 vs. 3.65 million/ day in 2019. A slew of regulations issued by the Road Transport Ministry aims to limit aggregator commissions to 20%, surge pricing to 1.5X, increase formalization of the workforce (drivers), and ensure driver and rider safety. These measures squeeze Ola’s margins on either side. Hence, the road to profitability has to take two paths – premiumization of existing offerings and efficiency in operations. 4 solution themes, Driver marketplace, Electric Mobility, Strategic Partnerships, and Analytics for premiumization, present themselves. There is significant value in investing in all four, as our analysis show.

Ola’s growth is staggering with several cost elements in check or along the path; Driver expenses as a proportion of revenues are the focus for profitability

The disruption in cab-rentals in India with the arrival of Ola in 2010 and Uber a few years later is well known. Their aggregator business model with an attractive combination of convenience and economic value for riders and the driver-partners has potentially changed riding habits for generations to come. Industry estimates indicate that Ola and Uber offer ~3.65 million rides every day, i.e., more than a billion rides every year.

Billions of rides every year offered by 2.5 million driver-partners is no small achievement. But for any business to sustain, it must be profitable. A glance at the FY19 financials for ANI technologies indicates that the Operating Margin is -54% (Fig 1). A comparative analysis of the same metric in the past suggests the Operating Margin has improved from -388% in FY16. The result has come on the back of a tremendous CAGR of ~39% in revenues (Fig 1).

Fig 1: Revenue and Operating margin – FY19 vs. FY16

Ride-hailing services have 5 primary operating costs (Fig 2)

Fig 2: ANI Technologies – Key Cost elements

Qwixpert team analysed the trajectory of each of these cost components for Ola (Fig 3). Sharp decreases in all cost elements indicate significant cost-cutting and efficiency improvement measures. “Driver expenses” remain critical to profitability.

Fig 3: ANI Technologies Operating margin waterfall (all values in % of revenues) – FY19 vs. FY16

Ola, in early 2020 decided to cap driver incentives to 5% of earnings, stating that the previous system, based on trips and logins, was seen as arbitrary and not to the liking of drivers. Commissions charged by Ola (i.e., Ola’s revenues) were simultaneously capped at a fixed 20% to ensure clarity among the driver community on their estimated daily and monthly earnings. These moves have led to driver’s earning falling, leading to lower cars on the road. This move could potentially manifest into a downward spiral with lower vehicles on the road, increasing waiting times for customers and hence higher churn, further impacting driver earnings.

Regulatory oversight into ride-hailing has increased. Parliamentary panels and Road Transport ministries have acted on appeals and complaints from the driver and rider community. New guidelines issued impact current margin improvement methods. Capping surge pricing, aggregator commissions (as a % of trip revenues), and the number of driving hours per day restricts earnings potential. Compliance with guidelines of daily driver log-in hours and social security benefits to drivers will increase costs.

The most critical dilemma that ride-hailing companies are trying to solve – Increase revenues and minimize driver expenses proportionate to incomes – has become more difficult.

Qwixpert explores four potential solution themes to achieve these twin objectives

  1. It is time for a marketplace model for drivers, and ride-hailing companies have every incentive to enable this

It is extremely crucial to understand the earnings profile of a ride-hailing driver. Considering a city taxi in an urbanized set-up like Delhi-NCR, where the driver works for 25 days in a month and is driving ten effective hours/ day, we have estimated earnings across 4 scenarios. In each of these scenarios, no additional incentives have been considered. A 3-year loan repayment period is considered, while the resale value is not included in the business case calculations.

Fig 4: Monthly earnings estimate for drivers-partners (w/o incentives)

Driver availability throughout the day and across locations is a key challenge. Hence, to incentivize drivers to stay logged in for longer and take those extra rides, bonuses based on total rides/day were introduced. The incentive system is neither sustainable financially for Ola nor safe for its riders (drivers staying on the road for long hours).

Getting new drivers on board to match the aggressive growth targets is also a challenge. High sign-up bonuses encourage drivers to take vehicle loans. Many drivers are unable to pay their EMIs as their loans are from local financers, charging high-interest rates. A marketplace model (Fig 5) will be useful in such a scenario.

Fig 5: The marketplace model

Since Ola allows multiple driver tagging to the same Vehicle (but only one at a time), smart fleet owners already use this model to maximize asset (taxis) utilization. Concerns regarding vehicle safety can be ensured by taking a security deposit from the 2nd driver and training and certifying driver-renters using Ola Skilling. Rent and/or revenue sharing models can be estimated using analytics.

Fig 6: Monthly earnings estimates for driver-partners (w/o incentives) – 2 drivers/ car

Qwixpert estimates a 200-270% increase in monthly earnings from a car through the marketplace model (Fig 6), as fixed costs of owning a car (Eg: EMI, taxes, Insurance) get apportioned over a larger revenue base. The marketplace model is a win-win for all: consumers (higher levels of service), drivers (higher incomes), and the aggregators (increased market access and reduced incentive payments).

  • Betting on Electric Vehicles and investing in them for long term

Total Cost of Ownership (TCO) analysis of EVs vs. ICEVs (Figs 8 & 9) for 4 wheelers and 2 wheelers indicates higher life-time value for the taxi segment, especially Taxis driven for longer distances every day. With the impetus from the Government to push EV adoption through subsidies, grants, and infrastructure-focused stimuli, EVs can generate significant earnings for the aggregators and the driver-partners.

Fig 7: TCO for 4W Sedan running ~150km/ day for 3 years      

Fig 8: TCO for 2W running ~100km/ day for 3 years

Ola’s strategic investment in Ola Electric Mobility is a step in this direction. A spate of investments from existing investors (Softbank and Tiger Global) and Global Auto OEMs (Hyundai and Kia) has made Ola Electric Mobility a Unicorn in its own right. Outside of investing in an all-electric vehicle fleet of cars, 2-wheelers, and autos, Ola electric is investing in support infrastructure, i.e., battery-swapping and charging stations. EV fleet can also be integrated into the marketplace model with a substantial increase in returns.

  • Strategic partnerships with select operators across the hospitality space can help tap into premium customers withncreased effectiveness

There are lots of synergies to be generated from strategic partnerships with hospitality services. Meru has tied up with MakeMyTrip (Fig 9) and is jointly promoting their cabs at airports through messages and email to customers who have booked tickets on MakeMyTrip. Their prompts across communication channels help reduce the traveler’s wait time once he/she lands. This example can be extended to other aggregators such as Zomato, where a customer booking a table at their favorite restaurant can be prompted to book a cab then and there. Analytics can be leveraged to prompt the rider after a reasonable amount of time, basis the type of destination, to book the return-cab. Partnership opportunities exist with BookMyShow, Booking.com, and other services of similar nature. Swiggy has also leveraged this synergy as customers booking an order are now given the option to watch a Netflix movie trailer.

Fig 9: Meru–MakeMyTrip partnership

  • Analytics at the front and center of revenue enhancement strategy

The alternative approach to proportionately reducing driver expenses is increasing revenues. The concept of surge pricing combines analytics with demand-supply economics. Incentivizing drivers who brave harsh weather and traffic conditions with higher fares and commanding a premium from customers for operating taxi services in such conditions are the key notions behind surge pricing. Likewise, ride-hailing services have also leveraged advanced analytics to ensure maximum driver availability at high demand routes, maximizing a driver’s earning potential and minimizing waiting times for riders. Qwixpert estimates several other applications, as below

  • Customer segmentation (categorizing customers into distinct segments) basis their ride-hailing behavior – Value conscious, service-oriented, etc. can yield a plethora of business benefits
    • Premiumization: Customers willing to pay a premium for higher service value can be actively encouraged to upgrade to higher-value offerings (Eg: Mini -> Prime)
    • Marketing effectiveness: Incremental RoI from marketing initiatives (Eg: Coupons) to acquire new riders or encourage existing customers to ride more
    • New product offerings: Frequent cancelations, surge pricing, and longer wait times lead to inferior customer experience for the office goer booking cabs every day. Meru reserve allows them to book cabs to and from the office for 30 days. Analytics helps identify and target the right customers to onboard, thereby enabling the service to scale fast. Over time, Meru can introduce carpooling services basis the office-goer demand footprint to maximize earning/ taxi and minimize carbon footprint.
  • Demand forecasting analytics: Time-series analysis of booking data can help forecast potential demand from different locations at various points in time. These forecasts can help
    • Re-route drivers basis demand to maximize driver earning and customer service
    • Target setting for driver onboarding teams using projections of current & future driver requirements
    • Build fungible driver business cases to assist driver onboarding teams
  • Geographic clustering analytics categorizing various cities into clusters based on demographic and macro-economic profiles can help during expansion/ new city launches. Combining geographic clustering with demand forecasting and customer segmentation analytics can accelerate new city launches and support operational decision making (driver onboarding, marketing effectiveness, driver re-routing) in the initial phase.

Conclusion

Outlook for mobility is muted now, especially with work from home continuing to be the norm in the service sector. However, with the active COVID-19 cases falling and several vaccines showcasing promise in 3rd stage trials, vehicular movement is expected to return to pre-COVID levels soon. Ola’s dream of turning profitable may not have materialized yet, and the COVID-19 pandemic has set them back by another year, if not more. But analysis of their financials indicates that they are on the right path. Besides, recent guidelines that limit earnings and increase costs will further impact profitability. Therefore, it is critical to look at long-term initiatives that focus on leveraging operational efficiencies and premiumization of services through incremental customer value. The four solution themes discussed – driver marketplace, electric mobility, robust data analytics, and strategic partnerships – can drive these objectives and achieve sustainable profitability.

Authors

Giridharan Raghunathan and Rahul Das

Sources:

  1. Ministry of Corporate Affairs, India
  2. Ola website
  3. Uber Website
  4. Meru Website
  5. Society of Manufacturers of Electric Vehicles
  6. Kapur, Narinder (2019), ‘SoftBank fires up Ola Electric with $250 mn capital infusion’ 2-Jul. Available at: https://www.vccircle.com/softbank-fires-up-ola-electric-with-250-mn-capital-infusion/
  7. Bhalerao, Sheetal (2020), ‘Ola Limits Driver Incentives To 5% Of Total Earning; Commission Charged From Drivers Fixed At 20% Across India’ 8-Jan. Available at: https://trak.in/tags/business/2020/01/08/ola-limits-driver-incentives-to-5-of-total-earning-commission-charged-from-drivers-fixed-at-20-across-india/
  8. Shrivastava, Aditi (2019), ‘Hail no more! Ola, Uber’s ride growth slows to a crawl’, 4-Jun. Available at: https://economictimes.indiatimes.com/small-biz/startups/newsbuzz/hail-no-more-ola-ubers-ride-growth-slows-to-a-crawl/articleshow/69641990.cms
  9. PTI (2020), ‘MakeMyTrip ties up with Meru to offer services of sanitised cabs at major airports’ 10-Jun. Available at https://economictimes.indiatimes.com/small-biz/startups/newsbuzz/makemytrip-ties-up-with-meru-to-offer-services-of-sanitised-cabs-at-major-airports/articleshow/76302163.cms?utm_source=contentofinterest&utm_medium=text&utm_campaign=cppst
  10. PTI (2020), ‘Meru Cabs launches office commute service Meru Reserve with no surge pricing feature’ 15-Oct. Available at: https://www.livemint.com/companies/news/meru-cabs-launches-office-commute-service-meru-reserve-with-no-surge-pricing-feature-11602758178351.html
  11. Singh, Shubham (2020), “Meru Cabs Looks To Add 10,000 EVs To Fleet, Sets Course On B2B Route”, Available at: https://inc42.com/buzz/meru-cabs-looks-to-add-10000-evs-to-fleet-sets-course-on-b2b-route/
  12. Upadhyay, Harsh (2020), “Transport ministry issues guidelines to regulate Ola, Uber; limits surge pricing” Nov-27, Available at: https://entrackr.com/2020/11/transport-ministry-issues-guidelines-to-regulate-ola-uber/

Minchin, Joshua (2020), “Ola and Uber face new regulations in India” Nov-30, Available at: https://www.intelligenttransport.com/transport-news/112231/ola-and-uber-face-new-regulations-in-india/

Medical Devices and Consumable: A Sunrise Sector with Lucrative Opportunities and Unique Challenges

Medical Devices and Consumable: A Sunrise Sector with Lucrative Opportunities and Unique Challenges 601 459 qwixpertadmin

Executive Summary

The pandemic hit India in February-March 2020 setting the healthcare industry in overdrive. Patients needed treatment for a hitherto unknown and highly contagious disease, for which the healthcare sector was not prepared. Hospitals and clinics faced a shortage of beds, medicines, consumables, doctors, and lifesaving medical equipment due to both supply disruptions and spikes in demand. Being a truly globalized sector, supply chain disruptions were acutely felt due to import restrictions, logistic hurdles, shutdown of manufacturing operations and labour migration.

At a broad level, the healthcare sector can be divided into 3 sub-sectors – (a) infrastructure (hospitals, diagnostics, clinics, dispensaries), (b) pharmaceuticals (medicines and APIs), and (c) devices and consumables. Devices and consumables, made from various sources – fabric, plastic, rubber, metal – is a ~Rs. 81,700 Cr. market and is growing at 15% YoY. During the pandemic, this demand accelerated in both the local and global markets and the sector witnessed some very innovative and quick shifts.

The industry offers opportunities in the domestic and export market. Three elements are critical to ensure successful market entry & sustained business performance. We elaborate on these in this paper.

  1. Manufacturing processes, standards and the regulations governing them
  2. Customer and distribution channel behaviour
  3. Potential in Indian and Overseas markets (Regulated and Less Regulated markets)

Introduction

The Indian healthcare industry is valued at Rs. 20 Lac Cr. (FY 20) and is expected to grow 15% YoY. Medical devices and consumables, a part of this industry, is made up of 4 subsegments (Figure 1):

Figure1: Medical Device Segment of India

Several estimates present an extremely favourable picture in the future for the medical devices and consumables segment. Steps taken by the Government – Sunrise sector under Make in India plans, production linked incentives to manufacturers, updated medical devices rules and policies, funds for infrastructure development (medical device parks) – are expected to bear fruit.

India’s exports contribute to 1.3% of global demand in pharma as against 0.4% in devices and consumables (Figure 2). Also, 50% of our exports of pharmaceuticals (Rs. 75 lac Cr.) are primarily to the more regulated markets of USA, Western Europe, therefore commanding a premium in both product range and price. However, in the medical devices and consumables space, our exports are skewed towards African and Middle Eastern nations with Indian brands targeting the economy product range.

Figure 2: Comparison of market size – Pharma vs Medical devices & consumables

India’s penetration in pharma and medical devices and consumables industries are very different. Domestic pharma manufacturers have advanced facilities that can manufacture drugs of high complexity, whereas in the devices and consumables segment, manufacturing capacity & capability are still at a nascent stage. The segment is characterized also by lack of superior technical expertise, high degree of fragmentation and focus on mass vs premium and niche products/ markets.

We believe that India can extend its superior standing in formulations to become a global leader in devices & consumables as well. With our knowledge and experience of pharma regulation across markets, India has a clear advantage and possibly a head start (as regulation on devices and consumables are generally not as complex for majority of the products) in this sector. Proactive Government policies and funds, growing interest among Indian manufacturers to tap into the vast global market (~Rs. 36 Lac Cr.), pandemic led demand growth and global interest in developing a 2nd manufacturing source beyond China should work in India’s favour. By 2025, experts believe India’s market may grow from Rs. 81,700 Cr. to Rs. 3.7 lac Cr. at a staggering 42% CAGR. Even conservative estimates peg the CAGR at 21% taking the market to Rs. 2.1 lac Cr.

The coronavirus caused an unprecedented surge in demand drawing considerable interest to this segment. For instance, Skanray Technologies formed a consortium with Mahindra & Mahindra and BHEL to manufacture up to 5,000 ventilators a month. Our PPE production capacity exploded from 62 lacs/ yr. to 26 crores/ yr. within a 3-month period thanks to 100+ manufacturers filling the void. Likewise, FMCG and Alcobev manufacturers produced and sold (also donated) alcohol-based hand-sanitizers. Large and small entrepreneurs in textile and apparel started supplying masks, gloves, and coveralls to institutional and individual buyers. While these examples are laudable, it is not enough to distinguish India in the medical consumables space and a more thought through, structured approach is needed to establish global leadership. This is however easier said than done. The segment has its own nuances and complexities. In this document, we examine the most critical of these to succeed.

  1. Manufacturing processes, standards and the regulations governing them

Manufacturing regulations are more stringent vis-à-vis other industries but create robust entry barriers

Medical devices are regulated by the Central Drugs Standard Control Organisation and fall under the purview of Indian Medical Device Rules, 2017. It categorises medical devices into 4 risk classes based on the invasiveness, duration of use and criticality of organ / organ function (Figure 3):

Figure 3: Medical Device Classes in India

According to the class of the device and the inspection process, approval authority and timeline to receive a manufacturing licence vary. A Class A/ B device maybe granted a licence in 45 days; whereas for a Class C/D device, licences can take up to 6 months (Figure 4).

Figure 4: Regulatory requirement for Class B and Class D Device

Compliance with extremely strict FDA/ EU regulations is required for export to regulated markets. Customers may expect USA, EU or WHO GMP certification for the manufacturing plants. Further, as medical devices are made in clean rooms, manufacturers have to upgrade their facilities to ISO Class 7 and below (varies basis product) to get the necessary clearance. To meet these standards, initial investment will be high, but the approvals bring credibility to the product and manufacturer. These ease entry into domestic as well as global markets and fast-track future approvals.

Figure 5: Implications of stringent regulations 

Long lead times to regulatory approval impact time to market

Devices can be classified as: devices with predicate or innovative devices. A device with predicate has the similar intended use, material of construction, and design characteristics as one that already has a licence and hence are eligible for manufacturing and import licences without clinical trials. Clinical trials are mandatory for innovative devices, and only after acceptable results are generated, a manufacturing/ import licence is granted. These mandatory tests determine the device’s performance and safety over several environmental conditions and may even require animal/ human trials. For instance, various kinds of stability and integrity tests are conducted on packaging material of drug products (Figure 6).

Figure 6: Types of tests conducted on packaging material of drugs

Testing duration depends on the shelf-life of the product in case of packaging consumables for drugs. For instance, oxidation tests on cotton for tablet bottles is conducted over a sufficiently large duration (3 – 6 months or more) and results are extrapolated (simulated) further for longer shelf life declarations. Despite simulations, fast-tracking is not very easy. Customers (pharma companies) and regulatory authorities do not dilute / deviate from conservative practices. While the time to develop a viable product may range between 1 – 3 years, depending on product complexity, it acts as a robust barrier for new entrants.

Figure 7: Implications of long lead time

Manufacturers can command premiums with solutions that lead to faster time to market for customers in select product-market combinations

Testing is often conducted and funded by pharma companies. Devices and consumables manufacturers have started to realize this as a source of value addition that commands a premium. For example, Daywyler – a manufacturer of vial stoppers has vast quantities of data on drug reactions for various stopper material compositions. Predictive analytical models generated using this data help Datwyler not just suggest appropriate material compositions for new products, but also help fast track regulatory approvals with years of actual test / use data. This allows pharma companies to be faster with the drug in the market, thereby adding considerably to their revenues and profits.

Datwyler also boasts of an excellent R&D and Regulatory advisory, capable of identifying the minutest of defects and conducting detailed root-cause analysis (in case of product recalls post go-to-market). Pharma companies value this support during contingencies and the subsequent speedy resolution of issues. Most domestic manufacturers in India do not possess high levels of such competencies and hence are substituted by imports despite higher cost and longer lead times.

Figure 8: Comparison of Profitability and Investment for different markets

However, premiums commanded depend upon the Product / Market combinations (Figure 8). For example, fluid / wound / fracture management products for Africa or South Asia will require a much lower investment in R&D capabilities and hence command lower premiums.

Figure 9: Implications of product premiumness

  1. Customer and distribution channel behaviour

Conservative customers with inertia impact pace of change but once entrenched yield long-term returns

Customers in the healthcare segment insist on high regulatory compliance from their devices and consumables suppliers. For instance, to partake in RFQ process in top hospital chains in India (especially for Class C or D devices), manufacturers often mandate FDA Approval/ CE Mark for the products and WHO GMP certification for the facility. This is driven by concerns over product quality and costly damage claims associated with defects.

Sales of consumables to pharma companies (Eg: cotton for tablet bottles), or component parts to device manufacturers suffer a high level of customer inertia to any change. For instance, a new supplier may necessitate re-doing the approval process from the start – including manufacturing audit of Tier 2 suppliers (if req.). Hence pharma companies tend to remain associated with suppliers over long contractual periods i.e. during the entire lifecycle of a drug.

Despite the challenges, customers onboard new manufacturers if they can reduce supply lead times leading to incremental revenues; or offer the required quality at lower costs thus adding to their bottom line. While the customer stickiness may prove to be a barrier to entry; once customers are onboarded, a steady source of revenue is assured for a considerable period.

Figure 10: Implications of customer inertia

Distinct distribution network (with distinct regulations) is critical for reach and growth

The distribution network for medical devices to hospitals, clinics and dispensaries include multiple intermediaries: distributors, dealers, and sub-dealers (also called surgical dealers), who require a CDSCO licence. The multi-level network ensures last-mile delivery and can cater to emergency demands. Central procurement of large hospitals roll-out annually/ bi-annually tenders (Figure 12):

Figure 11: Supplier selection process

For premium products, doctors play a significant role in brand selection (specifically for more critical products); they stick to familiar brands and tend to be very loyal. In the case of mass market products (Eg: disposable syringes) the L1 bidder tends to get the contract. Medical device representatives engage doctors through seminars, conferences, product demonstration and samplings to convince them about new brands/products.

For clinics, dispensaries and small hospitals in tier 2/3 cities, surgical dealers play a pivotal role in promoting brands to doctors, consolidating orders, and negotiating with hospital team (Figure 12). Dispensaries are important as availability translates into sales highlighting the strength of the distribution network. Manufacturers invest in BTL marketing on dealers (schemes, incentives) to be successful in this segment. (Figure 12)

Figure 12: Distribution process in Small hospitals, clinics, and dispensaries

Manufacturers must be ready to build a sales organization and invest in BTL for market coverage. Distribution is unique; it is a combination of channel/ product/ institution and hence fine tuning the selling approach focusing on the organization’s aspirations and capabilities is critical for success.

Figure 13: Implications of Distinct distribution Network 

  1. Market potential in India & abroad (Regulated & less regulated markets)

Potential for import substitution and profitable export is high

In 2019-20, India imported medical devices worth ~ Rs. 42,000 Cr.; the import dependency is as high as 86-90% for few high-end medical devices due to lack of medical grade indigenous manufacturing capacity. Imported brands like Beckton Dickinson, B Braun, Boston Scientific, Medtronic and Datwyler have high share in domestic market despite high prices, due to customer stickiness and their proven technical and manufacturing standards.

Medical devices are expected to be a flag-bearer of the Make-in-India initiative, and the Indian government is incentivising domestic manufacturing through a Rs 3,800 Cr. stimulus package. Indian manufacturers can compete with the MNC’s on cost, lower lead time and offer products that meet standards. They can establish themselves in the domestic market by initially targeting Tier 2/3 hospitals to gain brand recognition and then enter the bidding process for Tier 1 hospitals. An “invest as you earn” approach will put Indian brands on a solid path to growth and profitability as they move from import substitution to less regulated markets to regulated markets.

India exported Rs, 15,530 Cr. worth of medical devices in 2019, most of which were on the low-end like tubes, IV Cannulas, Breathing bags etc. These exports were to markets of Africa, Middle east, South America, and SE Asia with similar/ less stringent regulations than India. Over the years, by partnering with international healthcare NGO’s and local governments, Indian products have become widely acceptable. This is supported by good distribution network and local sales offices. Since cost is a key factor for purchase, Indian products in both high and low-end segments have good potential. Firms that target export markets can expect high growth and returns (Figure 14).

Figure 14: Comparison of Growth, Returns and Export %

A more detailed breakout of the import substitution and export market potential viewed through the lens of existing and new capabilities, product-market combinations and investment vs payback can sharpen the market entry / growth strategies of existing players and new entrants.

Figure 15: Implications of Import dependency

Conclusion

The market potential for medical devices and consumables is very high and investor interest is significant. While market size is just one axis to measure a market’s attractiveness, it is imperative to assess complexities across the value chain for entry or growth. These complexities and nuances are unique to the sector and hence a long-term play is advised – building competence and niche product capability, partnering with technical experts, creating a sustainable distribution presence, customer loyalty and keeping a good balance between domestic and exports for growth and profitability.

Authors: Samiran Das, Giridharan Raghunathan and Vasupradha Sridharan
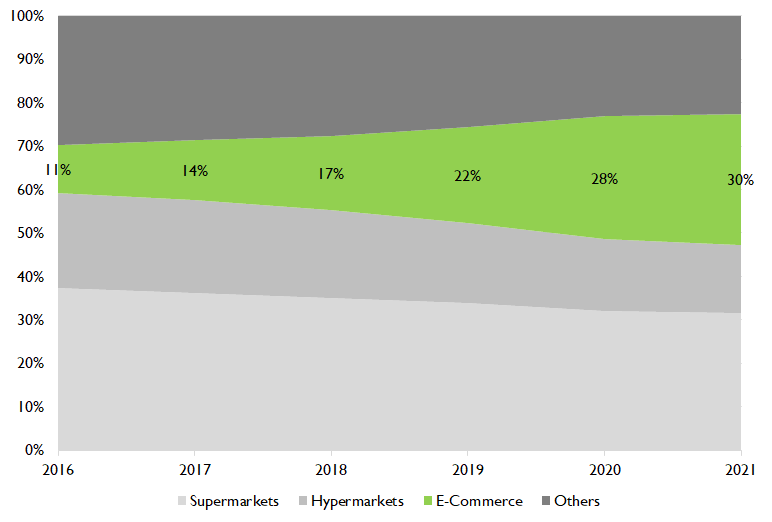
How can the Indian API industry grow rapidly and compete in the global market?

How can the Indian API industry grow rapidly and compete in the global market? 931 616 qwixpertadmin

Executive Summary

The Indian Pharmaceutical Sector is expected to grow to Rs. 7,371 Billion by 2025 from the current Rs. 3,746 Billion (FY 20). This growth will be driven by both domestic needs and export commitments.

India exports to over 200 countries with a major share of the US generic market (40%) and the UK (25%). India also exports to countries in Africa, the EU, ASEAN, Latin America, and the Middle East. Both exports and countries exported to are expected to increase in the foreseeable future. Export of finished dosage forms (FDF) are projected to grow at ~ 8 -10% over the next decade. However, the API / intermediate sector has been stagnant for a while despite it being the starting point for the FDF sector.

The Indian Government’s healthcare expenditure has grown between 15 – 20% from 2016, currently valued at Rs. 3,316 Billion. The domestic market will remain significant as the Government boosts healthcare. Budget allocation for domestic healthcare is 1.6% of GDP and is expected to grow duet the various inclusive growth strategies.

While India’s Finished Dosage Form (FDF) manufacturing is very mature and capable, the API and intermediate sector have to regain its relevance and demonstrated capability of the past. The off-shoring of API / Intermediate manufacturing due to lower prices led to (a) the sector not keeping pace with the FDF sector, (b) low or no technology upgrades, and (c) idle capacities. Fortunately, people competence and capability are available in abundance, which can gradually but surely re-establish leadership.

The Indian Government has also set aside Rs. 100 Billion to achieve self-reliance for end-to-end development of the pharmaceutical sector and to ensure national health security for a country of 1.4 Billion.

This white paper explores a few ways to truly leverage our strengths and manage risks to realize the potential of the pharmaceutical industry (API + FDF), especially in the small and medium category.

Background

India, considered to be the pharmacy of the world, has seen an enviable growth over the last three decades and today caters to 20% of the global generics market

India has established itself as the pharmacy of the world by exporting to global markets. It ranks 3rd worldwide for production by volume and 14th by value. It supplies 20% of the demand for Generic medicines and ~62% of Vaccines.

However, the bottleneck in the Indian pharma industry is its heavy reliance on China for APIs. Following the API shortage due to Coronavirus and the subsequent supply chain disruptions, the Indian Government has announced incentives to manufacture API and KSM (Key Starting Material) domestically. We believe that the internal environment and global sentiments are perfectly aligned for India to emerge as a strong manufacturer of API for domestic and export consumption. In this white paper, we examine the API industry and recommend growth strategies for API manufacturers.

API’s are critical products in need of import substitution and restructuring measures The India pharma industry is valued at Rs. 3746 Billion (Figure 1). It consists of two complementary product segments: API and FDF. The finished dosages (FDF), which are the final products sold to customers, are prepared by combining the API with other ingredients basis the formulation. The Indian FDF industry is a highly mature segment, comprising 75% of the pharma industry and with a significant export presence.

Figure 1: Indian Pharma Market Structure (FY 20)

The global API market is valued at Rs. 12,470 Billion and India is the third-largest producer, preceded by China and the USA. India plays in the high value- low volume market comprising of high potency APIs for regulated markets. Firms like Divi, Jubilant, and Shilpa have product-level leadership in global markets for a few niche APIs.

Despite the domestic manufacturing set up, Indian drug manufacturers rely on China for ~70% of API requirements (Figure 2). China has established its dominance in the market due to its cost advantage (~25% cheaper inputs), infrastructure capabilities, and chemical technology strength.

Figure 2: API dependencies of India (FY 19)

During the COVID-19 pandemic, Chinese industries were mandated into a protracted lockdown, causing the API’s supply chain disruptions. Indian drug manufacturers faced severe API shortages, with costs increasing by more than 100% for critical drugs. This highlighted the pharma industry’s risk management approach leading to precarious positions for both the country and the industry. The overdependence on China highlighted the fragility of our national health security and the industry’s business resilience.

India is not alone in this realization. More and more countries are recognising this and are developing alternate sources or moving to a China+One import strategy, creating a huge opportunity for India, given her API leadership in the not too distant past. The Government of India has also identified 53 APIs for which India is dependent on China and has provided incentives to build self-reliance. The schemes include the development of three Bulk Drug Parks and a production linked incentive scheme of Rs. 6,400 Crores. With the favourable market and manufacturing landscape, the API business can be a profitable venture, and we highlight the growth strategies for pharma companies looking to develop a more resilient and sustainable API business.

I. Integration is a key to unlocking higher growth and increasing global presence

Pharma firms in India can be classified into 3 segments basis the share of API in their business.

  1. The pure-play API companies such as Divi, Solara, and Aarti Drugs generate more than 95% of their revenue from Generic and Speciality API’s sold as raw material to develop and manufacture finished drugs by local and foreign pharma companies.
  2. The second segment consists of firms with a 30-60% share of API, such as Granules, Laurus Labs, and Ipca. These firms had started in the pure-play segment and have gradually integrated across the value chains. Firms like Wanbury and Nectar also offer CRAMS services focused on developing APIs.
  3. The last segment consists of firms that earn most of their revenue from FDF business but have an API business for captive consumption and small-scale external sales; they include the likes of Cipla, Cadila, and DRL.

While the pure-play API segment has very grown rapidly at 25% CAGR (FY 17- 20), their profitability is low owing to the high raw material costs (Figure 3). On the other hand, FDF firms have modest growth but have remarkably high profit margins of ~21%. Vertical integration can bring the best of both pure-play segments and increase access to export markets.

Figure 3: Segment Wise financial comparison (FY 20)

API manufactures have gradually entered the formulation business. This forward integration of API firms requires initial capital outflow, but profits can increase by 200-300% and increase the scope of exports.

For instance, Laurus labs’ revenue share from the formulation business was 2% in 2019 and 29% in 2020 (Figure 4). While the industry’s median profit in 2020 reduced to 9% due to Coronavirus, the integration helped Laurus stabilise at 11%. Their export revenue increased from 53% to 65% in 2020. Market Cap of Laurus has increased by over 2x during this period.

Granules India has also gradually integrated across the value chain. The Market Cap of Granules has moved by almost 3x driven by the approach, among other changes in the portfolio.

Figure 4: Integration of Laurus Labs in Formulation Segment (FY 2018- FY 2020)

The pandemic has reiterated the importance of developing domestic raw material sources, and formulation manufacturers should venture into upstream integration. They can grow more rapidly by offering a combined product portfolio. The captive consumption segment accounts for ~70% of the industry demand. Companies like Cipla, Zydus Cadila, and Dr. Reddy manufacture API for internal consumption as it reduces costs, and products can be launched with greater technical certainty and better control on launch timelines. Cadila, Cipla, and DRL have lower raw material costs (26-30%) compared to the industry median of 38%.

We think the time is right for the Indian FDF companies to in-house manufacturing of portfolio critical APIs while entering into more long term, partnership-oriented (profit sharing) contracts with pure-play Indian API / KSM / ingredient players. In-housing, followed by local in-country manufacturing, will be the preferred approach going forward. This strategy will also lead to better risk management and advantaged financials for all the players.

The API and FDF industries are expected to grow even more rapidly due to the Coronavirus crises. We believe that this is an opportunity for the industry at many different levels. The global demand for paracetamols, immunity boosters, and even specialised drugs and vaccines are expected to sustain. Historically, nearly 85% of the antibiotics used in the USA are imported from China. The supply shocks from China has affected Europe and the USA, and there is potential for India to step in and export to global markets

There is scope to establish manufacturing clusters comprising of API manufacturers, Formulation manufactures and FDF manufacturers. While a cluster had been set up in Telangana in 2016, several other ventures of a much larger scale are needed in the life sciences ecosystem. Manufacturers should also enter partnerships and Joint Ventures to improve quality, widen product portfolio, and enter global markets.  For example, Zydus Takeda- a partnership between Zydus Cadila and Takeda Pharmaceutical (Japan) is a 100% export-oriented unit developing API’s and KSM’s and undertaking research in complex substances.

II. Investment in Research and Development of complex API’s will command higher premiums and provide better margins

Research and development spend is an important metric used by global customers to evaluate the performance and capability of a supplier. Indian firms with high importance to R & D makeup 46% of the overall FDA DMF approvals and received 336 ANDA approvals in 2019.

The investment in research and development can increase profitability and provide higher growth. Firms such as Dr. Reddy, Biocon, Cipla, Cadila spend 6-9% on R&D with 20-25% PBT (Figure 5).

Figure 5: Comparison of R&D Spend and Profitability (FY 20)

Firms that have invested in R&D have achieved a growth rate of 9% against a 4% growth rate of firms with low R&D investments (Figure 6). By investing in R&D and subsequently filing for ANDA’s and DMF’s, firms can secure their future revenue stream. Most of the firms with high R&D spend also have FDA ANDA filings for the Critical APIs (as classified by the Government of India).

Figure 6: Comparison of R&D Spend and Growth (FY 20)

But expenditure on R&D is heavily skewed towards firms making finished dosages. Pure play API firms spend just 1% on R&D, compared to ~5% by FDF manufacturers (Figure 7). By investing in targeted product development, API firms can earn higher margins and increase growth potential. 

Figure 7: Segment-wise R&D Spend, ANDA and DMF Approval (FY 20)

API industry consists of two segments: Generics and Branded/ Innovative API. Generics consists of API’s for pain management, diabetes, cardiovascular disease; they have dominated the market with a share of 80%.

Branded/Innovative APIs are complex APIs that target niche therapeutic areas such as oncology, autoimmune and metabolic indications. It has a higher retail price and offers more lucrative margins. For instance, the API for paracetamol is $4/ kg, whereas Efavirenz, a drug to treat HIV, is priced as $95/kg in India. The cost of API’s for Innovative Drugs is 10% of the retail price as compared to 40% for generics. The branded segment is growing rapidly, and China is not considered a credible player in this segment due to competence gaps. This is a sustainable business segment for Indian API manufacturers to target.

R&D is the engine of any pharmaceutical business as it creates new products, opens up new markets, encourages new partnerships, and enhances revenue/profit growth in integrated business approaches. We believe a more internal and external collaborative approach can leverage the strength of the different stakeholders for a better return on the capital/resources deployed.

API manufacturers can collaborate with Contract research and manufacturing players (CRAMS) to pursue complex products’ research and development. It is a cost-effective solution that can reduce capital expenditure by 20-25% and offer a trained workforce.

III. Improving the manufacturing ecosystem and operational efficiency will generate a competitive advantage

The share of Chinese Imports to India was 1% in 1991 and has grown to ~70% in 2020. This rapid domination of Chinese APIs is due to the lower production cost driven by support from the state and efficient manufacturing practices.

India lags China in most manufacturing parameters (Figure 8). The capacity utilization of India API units < 35%, whereas China is > 70%. All productivity parameters for India (People + Material + Time) are behind China. China has sponsored large API clusters with basic support like CETP, uninterrupted power, treated water, developed road/rail network, subsidies on utilities that reduce operating expenses. The cost of borrowing is almost twice in India, and regulatory approvals in India take ~3 times longer. The overall manufacturing cost in China is 19% less than in India.

Figure 8: Comparison of the API manufacturing ecosystem of China and India (FY 19-20)

Another concern is the availability of raw materials, lack of natural resources like Limestone, and the relative nascency of the Chemical industry that supplies raw materials to the API industry. For instance, to produce API Tenofovir, the KSM Adenine is not made in India due to high infrastructure requirements.

While India’s ecosystem has not been as conducive as China, the current Government incentives are addressing the issue. There are two aspects to the Government Incentive (Figure 9):

Figure 9: Government incentives to boost domestic API Production

The Government’s announcement towards self-reliant API and ingredient manufacturing is a great step, but implementation will be key.

There are two levers to improve profitability in the API segment: increasing utilisation rate and improving productivity.  Domestic production of key API was prevalent in pre-1991 India, and imports from China accounted for a mere ~0.3% of demand. Due to the reforms of 1991, cheaper Chinese APIs started dominating the market. There are dormant production units that can be revied and upgraded to meet the current compliance and automation standards. This can result in a 30-40% increase in the top line.

Analytics can play a significant role in improving productivity; for instance, the current rate of Raw material wastages is 20-25%; by using IoT and analytics, it can be reduced to 5%. Similarly, labour productivity and supply chain can be optimised. Firms can target a 100-200% increase in profit margins by improving operational efficiency (Figure 10).

Figure 10: Levers to improve operational efficiency and profitability (values as of FY 20)

We believe a structured and holistic approach to cost reduction and a system driven end-to-end delivery process can make the API industry (as it stands today with all the legacy issues and technology obsolescence) more efficient by ~15%. This can easily make up part of the gap with China until a more thought-through, company-specific, and the government encouraged strategy is implemented.

Furthermore, the pandemic had a direct impact on the pharma industry, throwing up gaps in markets. At the strategic level, firms can re-examine the market conditions and identify new geographies and product segments to venture into. 

Summary

As the pandemic established the importance of developing a domestic API source, the API business has high growth potential. With many countries seeking alternate API suppliers and government policies that encourage domestic manufacturing of APIs, the situation is ideal for manufactures to establish and grow in this segment. Three major growth leavers in the API market are: Integrating across the value chain, investing in research and development of Niche products, and improving operational efficiency to become cost-competitive.

About the Authors

Samiran Das, Pharmaceutical Practice Lead

Maheswaran Ganapathy

Vasupradha Sridharan
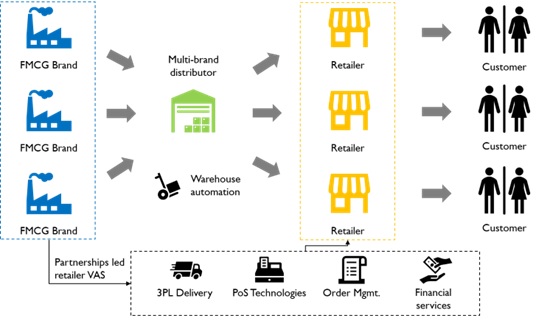
Indian B2C Digital business landscape

Indian B2C Digital business landscape 2560 1707 qwixpertadmin

Digital in numbers, but not the numbers corporate India is used to seeing

In this day and age, yesteryear business metrics such as revenue growth or profit margins, cannot adequately summarize the nascent yet vibrant digital industry. The reason why we call it nascent is that despite several decades of existence and investment, there is this overwhelming feeling of not having unearthed more than the tip of the iceberg. If you are still not convinced, just glance at the chart below.

No other industry today spawns so many innovative business models, many of which were launched from the comfort of a couch. The disruption to traditional industries due to these businesses is vast and almost immediate. Like most of you, we at Qwixpert have been repeatedly astonished by the progress made in thought and action by these businesses. “Digital” also dominates discussions in the corporate world, so much so that if a word cloud of all corporate utterances were to be created, “Digital” would probably take center place in the largest font size.

As “Digital” increasingly permeates our world, we have attempted to organize and structure it into a “Landscape.” We have limited our research to only Digital B2C businesses. The “Digital Landscape” is essentially a 2×2 matrix with “Business Model” and “Revenue Model” as its axes. These axes are defined as below

  1. Business model – What is the product/ service? How is it offered to or experienced by the consumer?
  2. Revenue model – How do they make money?

Business models can be classified into three kinds basis how consumers interact with the offerings on the digital platform

  1. Aggregator – This is the often heard of marketplace model where a platform is provided for manufacturers/ service providers to interact and transact with potential customers. E.g., “Swiggy” is an aggregator platform for restaurants.
  • Own products – The digital platform is essentially a touchpoint to interact with customers for their products or services. E.g., Byju’s is a learning platform where consumers can access Byju’s own content.
  • Hybrid – Here, the digital platform is a touchpoint for own products and hosts products from other manufacturers/ service providers. The own products offered by the platform owner may or may not differ from products listed from other suppliers. E.g., Amazon has a hybrid business model where listings are of individual brands and Amazon’s private labels.

While the fine print on business contracts will reveal subtle differences in their revenue generation models, four principal types stand-out

  1. Advertisements – Businesses pay for promotions and advertisements of their products/ brands on these platforms. E.g., Consumers are not charged for “Google searches” or “Facebook accounts,” while these companies generate the bulk of their revenues from ads and sponsored content.
  • Commissions – The platforms take a % of revenues or profits from every transaction that happens through it. E.g., Uber takes commissions on every ride booked on its app
  • Markup – The platforms purchase/ build/ manufacture products for a certain cost “X” and sell to consumers at “X-plus” through the digital platform. The key difference with the “Commissions” model is that the platform owns inventory, thereby running the risk of sitting on dead stock. E.g., BigBasket is an online food and grocery retailer which holds the inventory of the products sold on the platform
  • Subscriptions – Consumers pay a specific amount on a set frequency – Monthly, Quarterly, etc. – to access the platform. E.g., Netflix subscriptions to access their content

We have tried to “landscape” several industries into a 2X2 chart – Business Model X Revenue Model. While it is not an exhaustive list, a wide variety of companies operating in the following five industry sets are covered

  1. Retail – General Retail, Food & Grocery, Durables, Fashion, and Home décor
  2. Entertainment & Leisure – Social media, OTT, News, Gaming, Music, and Gifts
  3. Productivity – Education, Recruitment, Financial Services, Books, and Open Source
  4. Hospitality & Transportation – Automotive, Travel and Real Estate
  5. Services – Health & wellness, Household help, Matrimony, and Virtual meetings

While companies do have hybrid revenue models, a separate category has not been carved out, but both are highlighted in case multiple revenue models are present. E.g., LinkedIn generates revenues through advertisements as well as subscriptions.

Retail – General Retail, Food & Grocery, Durables, Fashion, and Home décor

Entertainment & Leisure – Social media, OTT, News, Gaming, Music, and Gifts

Productivity – Education, Recruitment, Financial Services, and Open Source

Hospitality & Transportation – Automotive, Travel and Real Estate

Services – Health & wellness, Household help, Matrimony, and Virtual meetings

Sources:

  1. https://www.visualcapitalist.com/what-happens-in-an-internet-minute-in-2019/
  2. Websites of companies highlighted